Logging is a fundamental practice in software development and data engineering. It is essential for building reliable and maintainable systems. Logging is especially helpful for debugging, monitoring performance and tracking historical events. In modern data platforms like Databricks, logging becomes even more critical due to the distributed nature and complexity of data processing tasks. Databricks, with its integrated notebook environment, offers unique considerations for implementing effective logging strategies.
In this article, we’ll go over the top 10 best practices for logging in Databricks Notebooks, making sure you have a solid strategy to monitoring and troubleshooting your workflow. We’ll start with the fundamentals of logging, explain its benefits and then go on to specific techniques and practices designed for the Databricks environment.
What is logging?
Logging is the systematic recording of events that occur during software execution. You can think of it as maintaining a detailed record of your application’s behavior, capturing everything from routine operations, performance metrics and unexpected errors in real time. Logs typically include:
- Application events and actions
- Errors and exceptions
- Performance metrics
- Resource utilization data
- User interactions and system state changes
Benefits of logging
Effective logging offers several advantages:
- Debugging. Logs trace issues by providing detailed information about what went wrong, where it occurred and the surrounding context. Without them, you’re guessing.
- Monitoring. Logs tell you how your application behaves over time—whether it’s performing well under load or showing a recurring error pattern.
- Audit trails. Logs track who did what and when. That’s key for security reviews and data access accountability.
- Performance analysis. Logging operation timing helps identify bottlenecks in your code or infrastructure.
- Compliance. In regulated industries, logs serve as evidence of when data was accessed or modified. GDPR, HIPAA and SOC 2 all depend on it.
- User behavior analysis. Logs reveal how users interact with your systems, informing design improvements and feature priorities.
Logging in Databricks Notebooks
Databricks Notebooks are extremely useful for data engineering, machine learning and analytics workflows. Their unique environment presents specific logging considerations:
- Interactive Execution Environment — Code is executed interactively, often requiring real-time logging.
- Distributed Computing Architecture — Operations may span multiple nodes. Note: Python logging generally captures events on the Driver node. Capturing logs from Spark worker nodes requires additional configuration.
- Multi-user collaboration capabilities — Multiple users can work simultaneously, making user-specific logging important.
- Integration with Apache Spark — Tight coupling with Spark requires capturing both notebook and Spark job logs.
Why notebook-specific logging matters
Standard scripts and Databricks notebooks behave differently. Here’s what that means for logging.
➥ Session-Specific Context: Since Databricks Notebooks are interactive, logs help you correlate actions with outcomes within the same session. This context is invaluable when you’re debugging or monitoring long-running processes.
➥ Integration with Python: You can use Python’s built-in logging module directly in notebooks. No new tools required.
➥ Centralized Storage: You can route logs to Unity Catalog volumes or cloud object storage, making them accessible across notebooks and clusters.
➥ Flexibility: Whether you’re logging a single cell or an entire pipeline, Databricks adapts to your approach.
Tools for logging in Databricks Notebooks
You can implement logging in Databricks Notebooks using:
- Python’s logging module: A flexible, built-in library for creating and managing log messages.
- Log4j: A Java-based logging framework that integrates with Spark, suitable for logging within Spark jobs.
- External logging services: Tools like Azure Log Analytics or third-party tools like Splunk can be integrated for centralized log management, enhancing monitoring and analysis capabilities.
Adding logging into your Databricks Notebooks can make a big difference. Not only are you getting ready for when things go wrong, but you’re also building a system that helps you keep improving your data processes. Think about it: the logs you create now might just help you fix problems later.
Now, let’s explore the top 10 Databricks logging best practices in Databricks Notebooks.
10 best practices for logging in Databricks Notebooks
Logging in to Databricks Notebooks is a must if you want to keep an eye on your data workflows and fix any issues that come up. Here are 10 best practices to take your logging strategy to the next level:
1️⃣ Databricks Logging Best Practice 1—Implement logging with Python’s logging module
Let’s start with the first best practice for logging in Databricks Notebooks: using Python’s built-in logging module. This approach is the simplest and most effective way to start logging in Databricks Notebooks. It allows for structured and customizable logging.
Prerequisite:
- Access to a Databricks workspace
- A configured Databricks Compute Cluster
- Basic to intermediate Python skills
Step 1—Log in to Databricks account
Log in to your Databricks account using your credentials. If you’ve already set up your account, this step is straightforward.
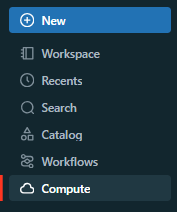
Once logged in, click on “Workspace” from the left sidebar to access your Databricks notebooks, clusters and data.
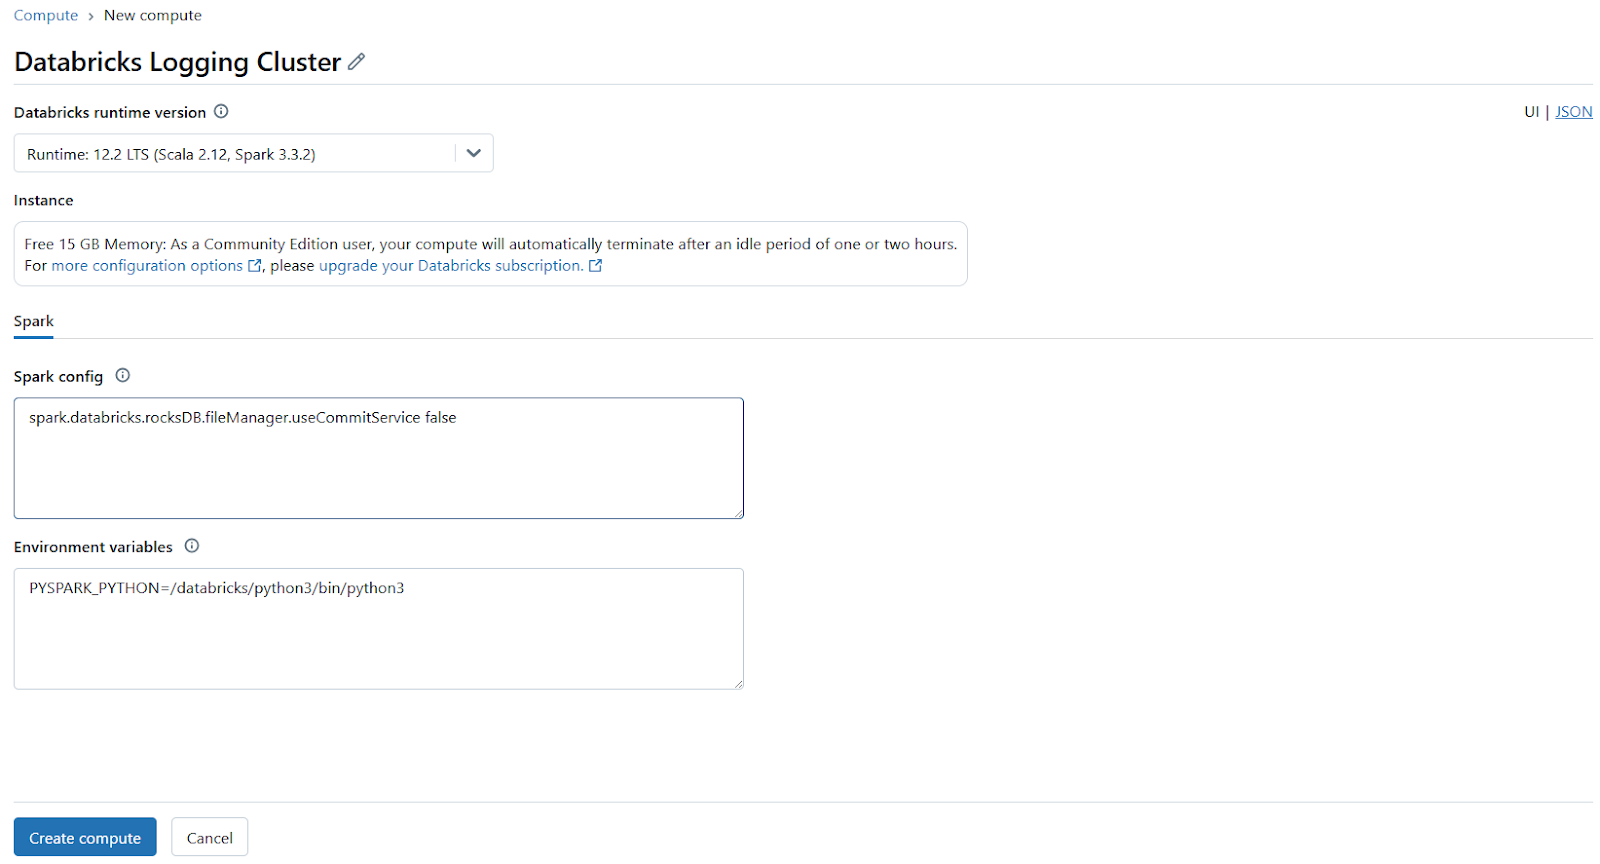
Step 3—Configure Databricks compute cluster
Before running any code, you need an active Databricks compute cluster. To do this, navigate to the Compute section on the left sidebar.
If you don’t have a cluster or need a new one, click Create Compute.
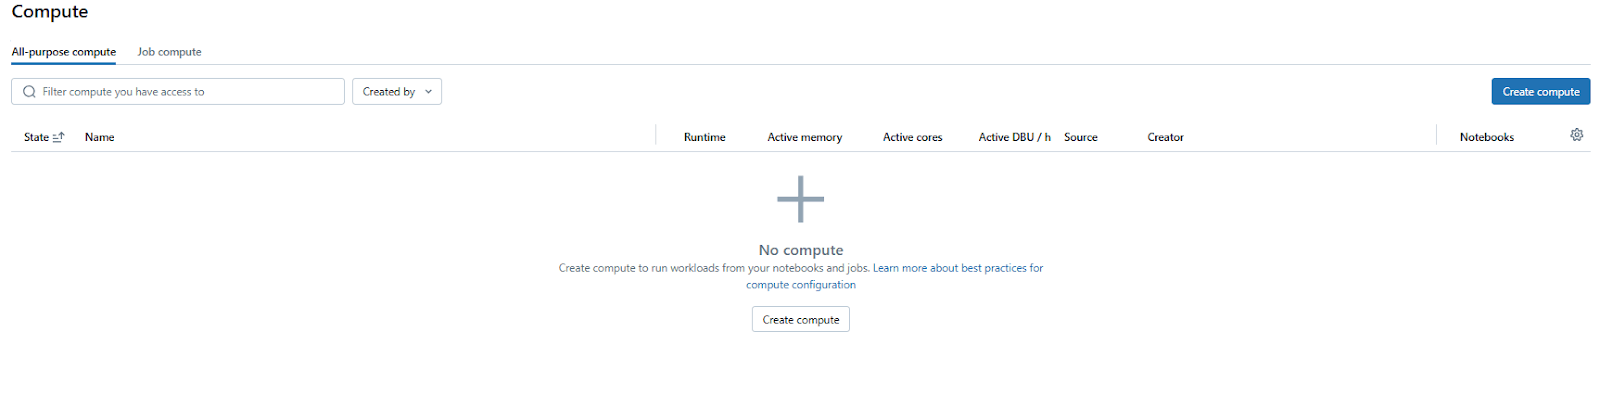
Then, configure the cluster settings, such as the Databricks runtime version and worker count. Finally, start the cluster if it isn’t already running.
Step 4—Open a new Databricks Notebook
In your workspace, click the “+ New” button and select “Notebook“.
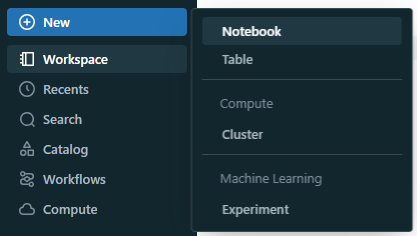
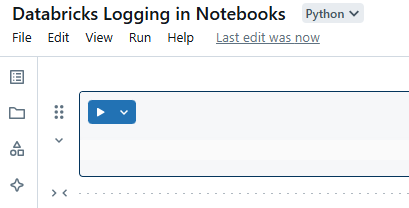
Then, choose Python as the language and name your Databricks Notebook, for example, “Databricks Logging in Notebooks“.
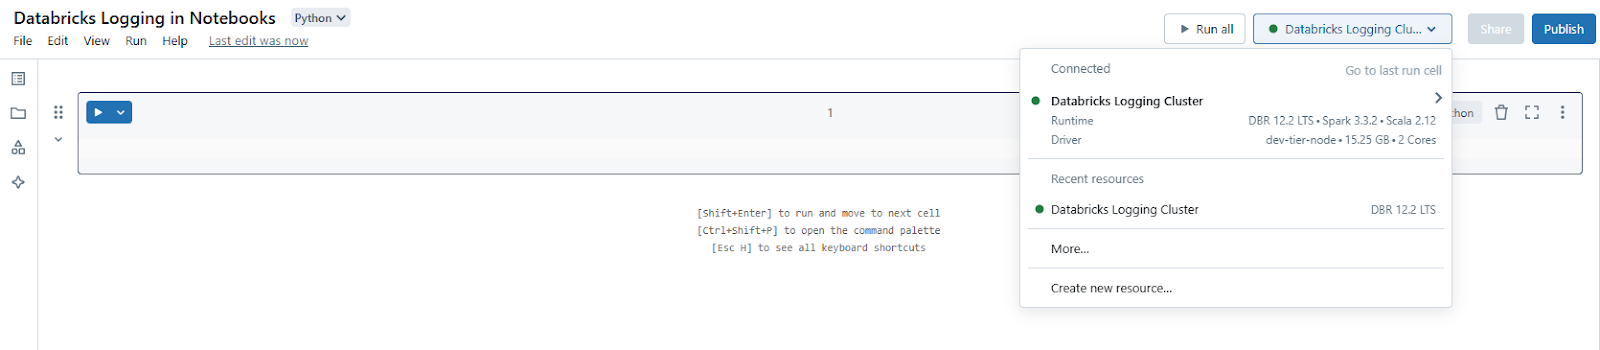
Step 5—Attach Databricks Notebook to cluster
At the top of the Databricks Notebook, select the cluster you configured in Step 3 to attach it.
Step 6—Import the Python logging module in Notebooks
Now, start by importing the logging module in your Databricks Notebook:
import loggingStep 7—Configure the logger
Set up a logger with a specific name and define its logging level. The logging level determines the severity of messages that the logger will handle. For comprehensive logging, you might choose DEBUG</code>; for general operational messages, INFO is appropriate. We will delve deeper into this section in the next best practice section.
logger = logging.getLogger('databricks_logger')
logger.setLevel(logging.INFO)
Step 8—Add a stream handler
To display log messages directly in the Databricks Notebook output, add a StreamHandler. This handler sends log messages to the console.
stream_handler = logging.StreamHandler()
stream_handler.setLevel(logging.INFO)
Step 9—Test the logging configuration
Establish a consistent format for your log messages to include timestamps, logger names, log levels and the actual message.
formatter = logging.Formatter('%(asctime)s - %(name)s - %(levelname)s - %(message)s')
stream_handler.setFormatter(formatter)
Step 10—Attach the handler to the logger
With the handler configured, attach it to your logger.
logger.addHandler(stream_handler)Step 11—Avoid duplicate log entries
When you re-run notebook cells, Python may add duplicate handlers to the same logger object. Check before adding:
if not logger.hasHandlers():
    logger.addHandler(stream_handler)
Step 12—Implement logging in your code
You can now use the logger to record messages at various severity levels throughout your Databricks Notebook.
logger.debug("Debug message: Useful for troubleshooting.")
logger.info("Info message: General information.")
logger.warning("Warning message: Indicates potential issues.")
logger.error("Error message: An error occurred.")
logger.critical("Critical message: Severe issues requiring immediate attention.")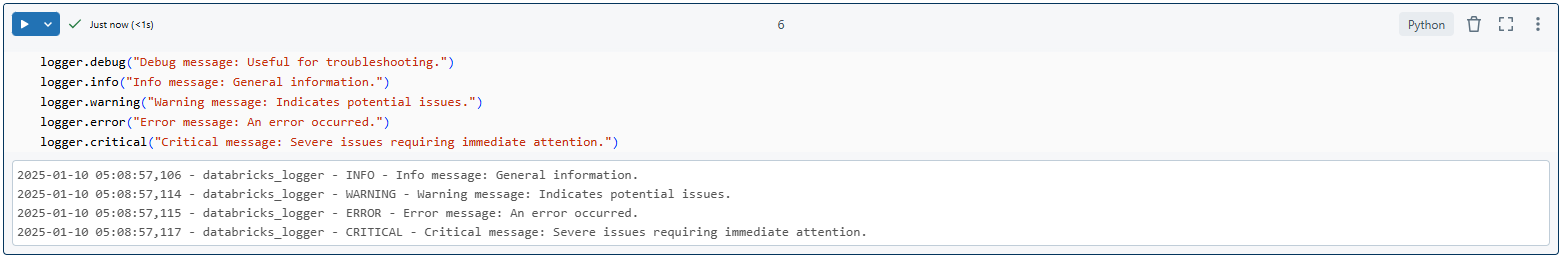
Step 13—Optional: Persist logs to a file
Important: DBFS root and DBFS mounts are deprecated and not recommended by Databricks. New workspaces are provisioned without access to these features. Use Unity Catalog volumes instead.
If you prefer to save logs to a file for persistent storage, you can add a FileHandler. However, direct logging to Databricks DBFS (Databricks File System) can be problematic due to write permission issues. A common workaround is to log to a local file and then move it to DBFS after the notebook execution completes.
file_handler = logging.FileHandler('/tmp/databricks_log.log')
file_handler.setLevel(logging.INFO)
file_handler.setFormatter(formatter)
if not logger.hasHandlers():
		 logger.addHandler(file_handler)
After your Databricks Notebook runs, you can move the log file to Databricks DBFS:
dbutils.fs.mv('file:/tmp/databricks_log.log', 'dbfs:/FileStore/logs/databricks_log.log'
Key points to bear in mind:
Logging directly to DBFS from a FileHandler can be tricky because of file permissions. A workaround is to use a temporary DBFS path and then move it to a more permanent spot.
Make sure you have permission to write to the /dbfs/tmp/ path or wherever you’ll be writing temporary logs.
Remember, after each notebook run, you’ll need to manually or programmatically move logs if you want them stored long-term in DBFS.
Step 14—Integrate Logging into Your Code
Use the logger throughout your Databricks Notebook to track the progress and status of operations:
try:
		logger.info("Starting a data processing task...")
		 # <Example task>
		 result = 1 / 0	 # Intentional error
except Exception as e:
		logger.error(f"An error occurred: {e}")
finally:
		 logger.info("Task complete.")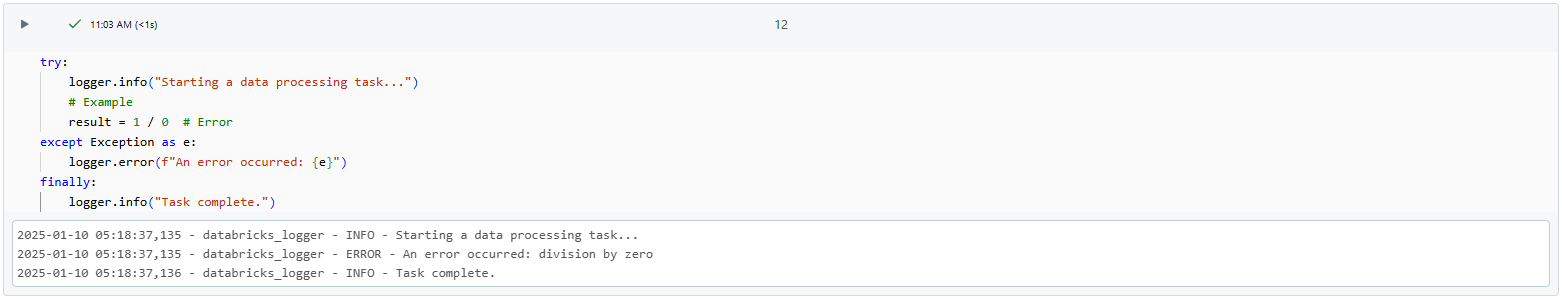
Step 15—Test the Databricks Logging Setup
Run the Databricks Notebook to check if logs appear in the console or wherever you’ve set up external logging.
2️⃣ Databricks Logging Best Practice 2—Configure logging levels appropriately
Logging levels, as discussed in the best practice above, help you filter out unnecessary information by controlling what appears in your logs. In Python’s logging module, you can configure these levels to determine which messages are logged based on their severity. Now, here’s how to put logging levels to good use in Databricks Notebooks to streamline your logging output.
a) Debug level
Use the DEBUG level during development to capture detailed information about the application’s behavior. It provides insights into the flow and state of your code. It’s like having a magnifying glass on your code’s every move.
logger.debug('Detailed debug information')b) Info level
The INFO level is ideal for logging general operational messages that describe the normal flow of your application. Use it to track key events or milestones.
logger.info('Application started')c) Warning level
Log at the WARNING level when something might cause problems in the future or if there’s an issue that doesn’t immediately impact functionality. It acts as an early alert system.
logger.warning('Resource usage is high')d) Error level
Use the ERROR level when an issue occurs that prevents a specific operation but doesn’t stop the entire application. These logs highlight problems requiring attention.
logger.error('Failed to open file')e) Critical Level
The CRITICAL level is reserved for severe issues that may cause the program/application to crash or indicate a significant failure. These logs demand immediate action.
logger.critical('Out of memory, application stopping')Set the appropriate logging level based on the deployment stage:
DEBUG for development:
During development, set the logging level to DEBUG to capture detailed insights about your application. This helps identify issues and refine your code effectively. logger.setLevel(logging.DEBUG)
WARNING / ERROR for production:
In production, focus on potential issues or errors to avoid excessive logging. Set the level to WARNING or ERROR to make sure the logs remain concise and relevant. logger.setLevel(logging.WARNING) # or ERROR
To keep your logs from getting out of hand, customize your logging levels for each deployment stage. Don’t try to log everything—focus on capturing the info that’ll help you maintain or debug your program quickly.
3️⃣ Databricks Logging Best Practice 3—Use structured logging with JSON
Structured logging in JSON format simplifies parsing and analysis, making it especially useful when working with Databricks Notebooks. Here’s how to set up structured logging in JSON format for better log management and integration.
Why JSON for logging?
JSON logs can be easily integrated with analytics tools and are machine-readable, which is beneficial for logging in Databricks where you might want to pull log data for further processing or visualization.
Implementing JSON logging:
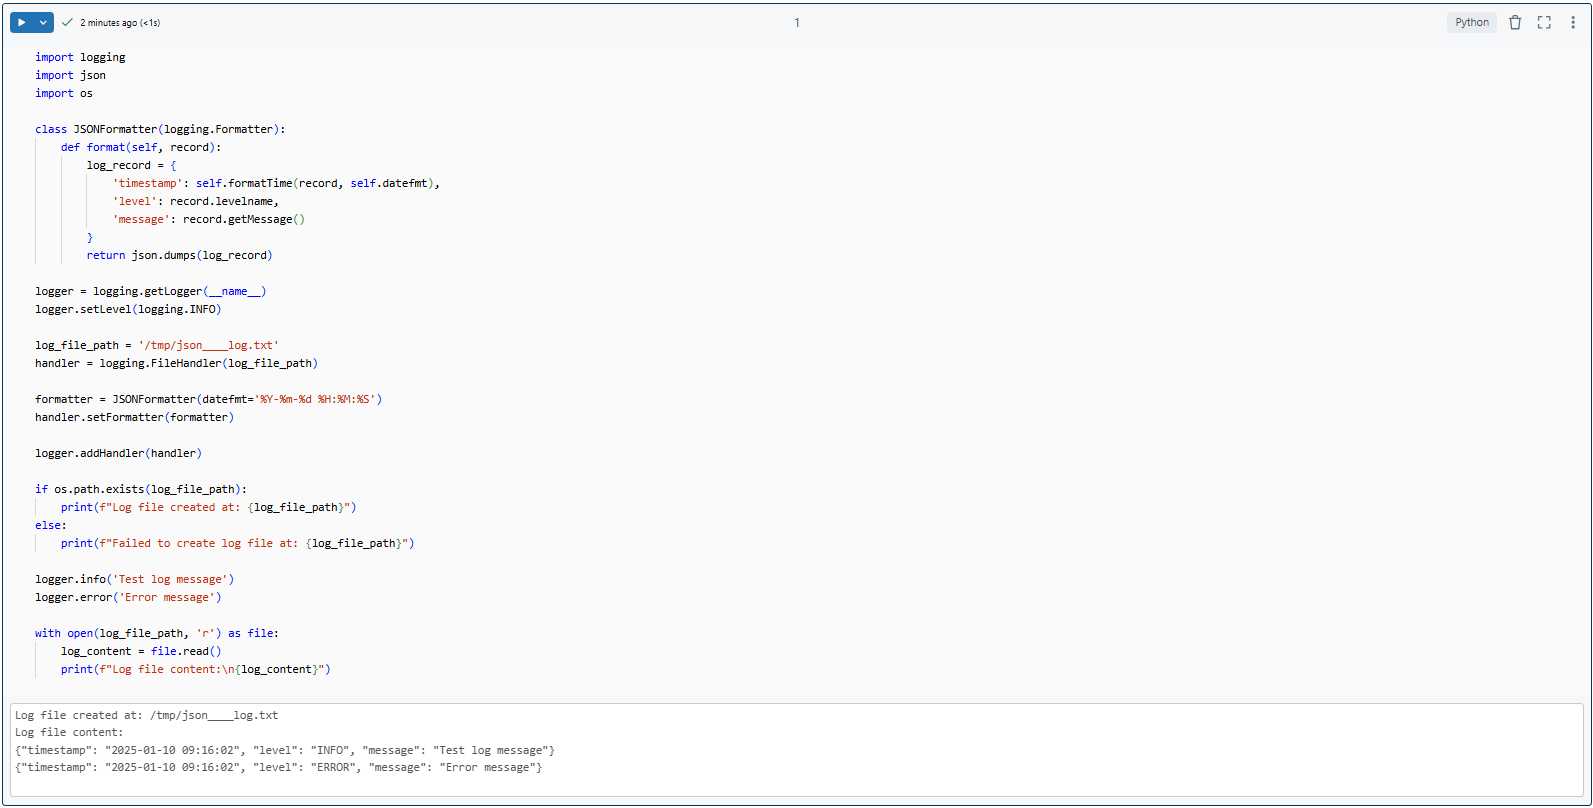
Below is an example to output logs in JSON format:
import logging
import json
import os

class JSONFormatter(logging.Formatter):
		def format(self, record):
				 log_record = {
						 'timestamp': self.formatTime(record, self.datefmt),
						'level': record.levelname,
						'message': record.getMessage()
				}
				 return json.dumps(log_record)

# Create a logger object
logger = logging.getLogger(__name__)
logger.setLevel(logging.INFO)	 # Set your logging level

# Create a file handler
log_file_path = '/tmp/json____log.txt'
handler = logging.FileHandler(log_file_path)

# Set the formatter for the handler
formatter = JSONFormatter(datefmt='%Y-%m-%d %H:%M:%S')
handler.setFormatter(formatter)

# Add the handler to the logger
logger.addHandler(handler)

# Debug statement to check if the file is created
if os.path.exists(log_file_path):
		 print(f"Log file created at: {log_file_path}")
else:
		print(f"Failed to create log file at: {log_file_path}")

# Log messages
logger.info('Test log message')
logger.error('Error message')

# Debug to check the content of the log file
with open(log_file_path, 'r') as file:
		 log_content = file.read()
		print(f"Log file content:n{log_content}")
What happens in the code
a) JSON formatter:
- A custom JSONFormatter class converts log records into JSON format.
- Each log entry includes a timestamp, severity level and message.
b) Logger configuration:
- A logger object is created and set to INFO level.
- A file handler is added to save logs to a file (
/tmp/json____log.txt).
After you run this code, your log file (json____log.txt) will contain entries like:
{"timestamp": "2025-01-10 09:16:02", "level": "INFO", "message": "Test log message"}
{"timestamp": "2025-01-10 09:16:02", "level": "ERROR", "message": "Error message"}
Here is what your output should look like:
Databricks logging using JSON format – Databricks Logging Best Practices
Why JSON?
- Easier to search, filter and analyze programmatically
- Integrates directly with external tools like Datadog or Splunk
- Consistent, structured output across all notebooks
- Queryable with Spark SQL when stored as a Delta table
4️⃣ Databricks Logging Best Practice 4—Write meaningful log messages
A log message that says “Error” tells you nothing. A message that says “Failed to process record ID 1234 in table sales.transactions: ZeroDivisionError at line 67” tells you exactly where to look. Clear messages are the difference between a 10-minute fix and a 2-hour investigation.
import logging

# Set up logger
logger = logging.getLogger(__name__)
logger.setLevel(logging.INFO)

# Create a console handler
console_handler = logging.StreamHandler()
console_handler.setLevel(logging.INFO)

# Add handler to logger
logger.addHandler(console_handler)

def process_data(data):
		 try:
				 result = data * 2	# Example
				 logger.info(f'Data processed. Input: {data}, Output: {result}')
		except Exception as e:
				logger.error(f'Failed to process data. Input: {data}, Error: {e}')

process_data(10)
So what’s happening here:
a) Informational logging: When the data is processed successfully, the try block logs an informational message. This message includes the input and output, helping you trace the flow of data.
Example log:
Data processed successfully. Input: 10, Output: 20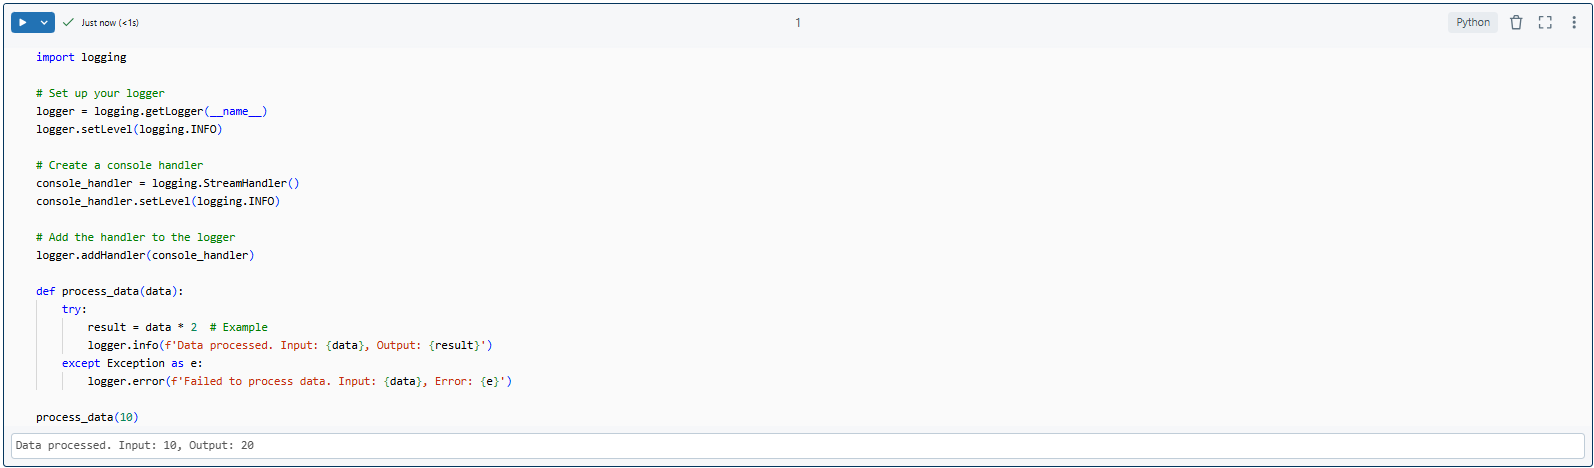
b) Error logging: If something goes wrong, the except block logs the error, including the input data that caused it and what the error is. That info is super helpful for figuring out what went wrong.
Example log:
Error processing data. Input: 10, Error: division by zero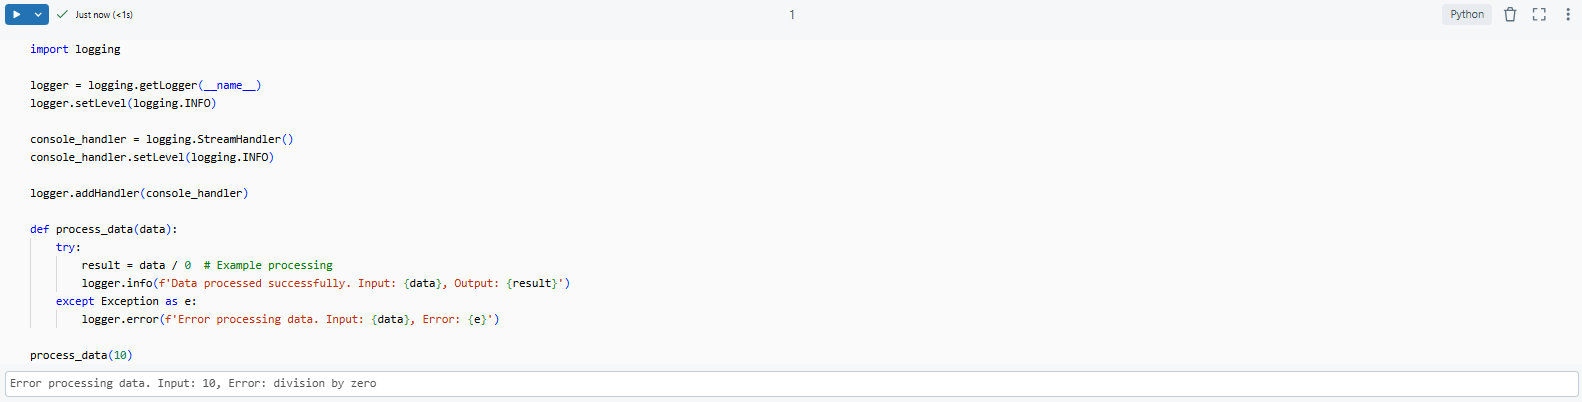
Guidelines for meaningful log messages:
- Describe what happened: “Data processed successfully,” not “Done”
- Include the relevant inputs and outputs so you can reproduce the issue
- Specify the function or module name in complex systems
- Avoid vague messages like “Something went wrong” or “Error occurred”
5️⃣ Databricks Logging Best Practice 5—Add timestamps and maintain a consistent format (ISO-8601)
Adding timestamps to logs in Databricks Notebooks is essential for tracking event sequences. Use the ISO-8601 format for consistency across logs.
Why Use ISO-8601 Timestamps?
➥ Standardized Format: ISO-8601 (%Y-%m-%dT%H:%M:%S) provides a universally recognized timestamp format (like 2025-01-10T09:29:38).
➥ Chronological Sorting: It lets you sort and analyze your logs in order, so you can see what happened when.
➥ Tool Integration: ISO-8601 works seamlessly with monitoring and analytics tools that need a standard timestamp format.
Here is an example of adding ISO-8601 timestamps to Logs:
import logging

# Set up the logger with ISO-8601 timestamp format
logger = logging.getLogger(__name__)
logger.setLevel(logging.INFO)

formatter = logging.Formatter('%(asctime)s - %(name)s - %(levelname)s - %(message)s', datefmt='%Y-%m-%dT%H:%M:%S')
handler = logging.StreamHandler()
handler.setFormatter(formatter)
logger.addHandler(handler)

# Log an example message
logger.info('Test message with a timestamp')
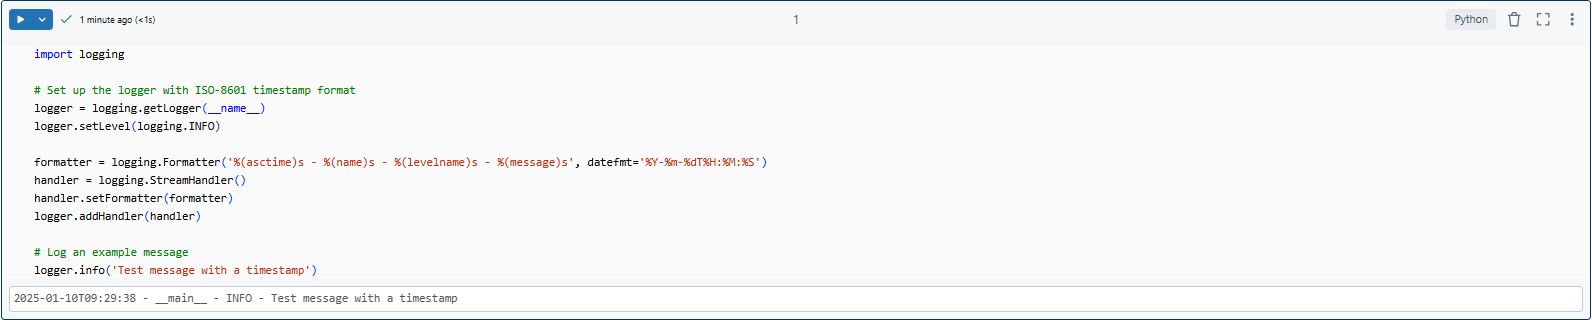
Here you can see that ISO-8601 format (%Y-%m-%dT%H:%M:%S), looks like 2025-01-10T09:29:38.
This standardized format is beneficial when sorting logs by time to view the sequence of events. It also helps in integrating logs with monitoring or analytics tools that require timestamps in this format.
Most logging frameworks include timestamps by default. However, make sure they follow the ISO-8601 format to maintain consistency across systems and tools.
6️⃣ Databricks Logging Best Practice 6—Periodically test logging configuration
Don’t take a “set it and forget it” approach to logging in Databricks Notebooks—that can backfire. Instead, test your logging setup often to catch potential issues. This way, you can ensure your logs stay reliable.
Why test your logging configuration?
1) Catch configuration drifts
Over time, updates to Databricks or changes in your environment can alter how logs are recorded or stored. Regular testing helps identify and fix these issues before they become bigger problems.
2) Verify log retention
Are your logs being stored for the expected duration? This is particularly important for meeting compliance requirements or reviewing historical data.
3) Evaluate log quality
Are your logs providing actionable insights? Regular checks help ensure your log messages are clear, relevant and valuable for debugging or monitoring.
4) Confirm log accessibility
Can you access your logs easily from storage locations like DBFS, Azure Blob Storage, or Amazon S3? Periodic testing guarantees your logs are accessible when needed.
Quick checklist for periodic testing:
- Create test log entries at each level and verify they appear in the expected destination
- Confirm logs are writing to the correct storage path with correct permissions
- Verify log retention policies are working as expected
- Review a sample of recent logs to confirm messages are clear and structured correctly
- Check that timestamps follow ISO-8601 with timezone info
Testing your logging setup often helps keep everything running smoothly, accurately and easily accessible. Catching problems early on saves you from surprises down the line. This also means you can keep your logs in great shape for when you need to monitor, debug, or meet regulatory requirements.
7️⃣ Databricks Logging Best Practice 7—Store logs in a centralized location
Centralized log storage means all your logs live in one place; queryable, secured and retained according to your policies. It’s much easier to investigate an issue when you’re not jumping between cluster driver logs, notebook outputs and separate files scattered across environments.
Option 1: Unity Catalog volumes (recommended)
Unity Catalog volumes are the modern replacement for DBFS-based log storage. They integrate with Databricks’ access control framework and work across all cloud providers. DBFS root and DBFS mounts are deprecated, so any existing code writing to /dbfs/FileStore/ should be migrated.
import logging

logger = logging.getLogger(__name__)

logger.setLevel(logging.INFO)

# Replace with your catalog, schema and volume names

handler = logging.FileHandler('/Volumes/main/default/logs/app_log.txt')

formatter = logging.Formatter(

    '%(asctime)s - %(name)s - %(levelname)s - %(message)s',

    datefmt='%Y-%m-%dT%H:%M:%S%z'

)

handler.setFormatter(formatter)

logger.addHandler(handler)

logger.info('Logging to Unity Catalog volume')
Option 2: Cloud object storage
For teams needing logs accessible outside Databricks, write directly to cloud object storage. Mount points using DBFS are deprecated; use Unity Catalog external locations or the cloud SDK instead.
# Example: Azure Data Lake Storage Gen2 via external location

handler = logging.FileHandler('/Volumes/main/default/logs/app_log.txt')

# Or use the cloud storage SDK to write directly to S3/ADLS/GCS
Option 3: Delta tables for queryable logs
For large-scale logging across many jobs, write structured log entries as a Delta table. This lets you query logs with Spark SQL and build dashboards directly on your log data—a pattern the Databricks blog covers in depth.
from pyspark.sql import SparkSession

from datetime import datetime, timezone

spark = SparkSession.builder.getOrCreate()

def log_to_delta(level, message, table_path):

    log_entry = [{

        "timestamp": datetime.now(timezone.utc).isoformat(),

        "level": level,

        "message": message

    }]

    df = spark.createDataFrame(log_entry)

    df.write.format("delta").mode("append").save(table_path)

log_to_delta("INFO", "Pipeline started", "/Volumes/main/default/logs/pipeline_log")
Why centralization matters:
- Single source of truth for debugging across notebooks and clusters
- Easier to implement and enforce retention policies
- Simpler access control—one location to secure rather than many
- Enables cross-notebook and cross-cluster log correlation
8️⃣ Databricks Logging Best Practice 8—Implement error handling with try-except blocks
In Databricks Notebooks, proper error handling and logging are essential for smooth operation and debugging. Using try-except blocks effectively helps you catch and log exceptions, making it easier to identify issues and resolve them quickly. Here’s how you can do it:
Here is an example of error handling and logging:
import logging

# Set up your logger
logger = logging.getLogger(__name__)
logger.setLevel(logging.ERROR)

# Configure handler to write to a file in DBFS
handler = logging.FileHandler('/dbfs/FileStore/logs/error_log.txt')
formatter = logging.Formatter('%(asctime)s - %(levelname)s - %(message)s')
handler.setFormatter(formatter)
logger.addHandler(handler)

def divide_numbers(a, b):
		try:
				result = a / b
				return result
		 except ZeroDivisionError:
				# Log and handle the specific error
				 logger.error('Attempted to divide by zero')
				return "Error: Division by zero"		except Exception as e:
				# Catch any other exceptions
				logger.error(f'An unexpected error occurred: {e}')
				Raise
Try Block {
- Attempts to execute code that might raise an exception. In this case, it tries to divide two numbers. If the denominator is zero, a ZeroDivisionError is raised.
}
Except Blocks {
- ZeroDivisionError: Specifically handles division by zero, logs the error and returns a custom error message.
- General Exception: Catches any other unexpected errors, logs them and re-raises the exception for further handling if necessary.
}
Handling exceptions during function execution
You can test the error handling like this:
try:
		result = divide_numbers(10, 0)
		print(f"Result: {result}")
except Exception as e:
		# Handle the exception
		print(f"Operation failed: {e}")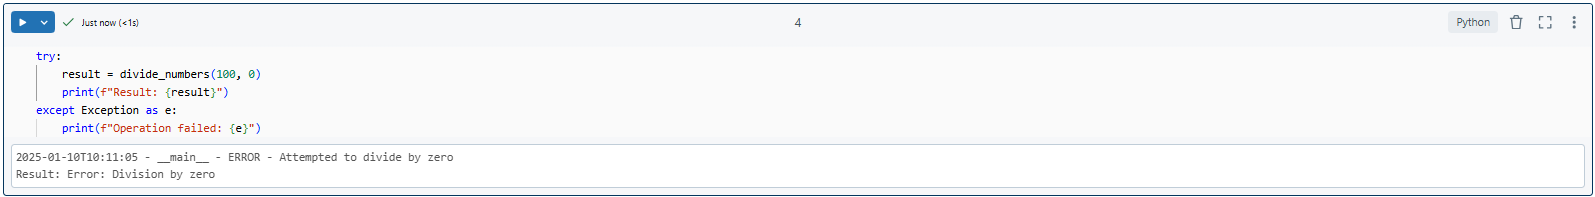
try:
		result = divide_numbers(200, 100)
		 print(f"Result: {result}")
except Exception as e:
		 print(f"Operation failed: {e}")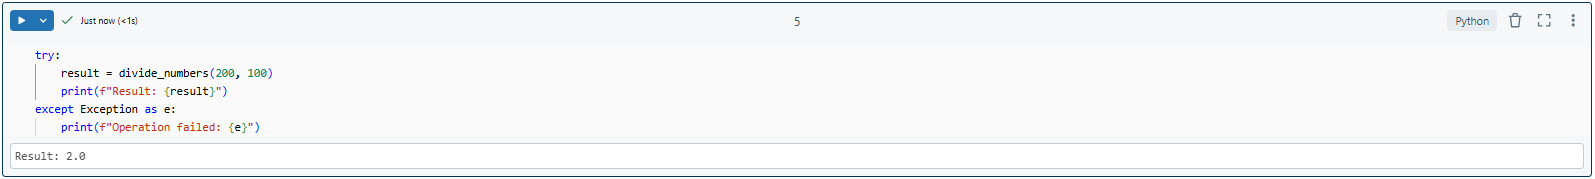
9️⃣ Databricks Logging Best Practice 9—Integrate Databricks with log analytics tools
To improve your monitoring and log analysis, it’s a good practice to integrate Databricks with log analytics tools. These tools can help you gain deeper insights, visualize metrics and monitor logs more effectively. Here are some of the top tools you can use with Databricks:
1) Azure Log Analytics
If you’re already using the Azure ecosystem, Azure Log Analytics. It integrates smoothly with Databricks and other Azure services, making it easier to query logs with Kusto Query Language (KQL). This allows you to dive deep into your logs and extract valuable insights, such as performance metrics, error rates and more.
2) Datadog
Datadog is known for its comprehensive monitoring capabilities and can ingest logs from Databricks to provide real-time observability across your applications. This includes metrics, traces and logs in one place.
3) Splunk
Splunk offers powerful log analysis capabilities with its search-processing language. You can configure Databricks to send logs to Splunk for centralized log management and analysis.
4) Grafana + Loki
Grafana paired with Loki (its log aggregation backend) gives you a lightweight, open-source observability stack. When integrated with Databricks, you get rich log visualizations and the ability to correlate logs with other metrics data.

Each platform has trade-offs. Azure Log Analytics is the natural fit for Azure Databricks users already in the Microsoft ecosystem. Datadog and Splunk are better for multi-cloud or multi-platform environments. Grafana + Loki is a solid option if you’re minimizing vendor costs.
Databricks Logging Best Practice 10—Enable Databricks audit logs
Audit logs track who did what in your Databricks workspace—logins, cluster creation, data access, job runs, configuration changes. These are distinct from your application logs; audit logs are about platform-level activity. They’re your compliance evidence.
The modern approach: system tables
Databricks recommends using the system.access.audit system table to access audit logs. This table requires a Unity Catalog-enabled workspace and provides a queryable, centralized view of all audit events across your account.
SELECT

    event_time,

    user_identity.email AS user,

    service_name,

    action_name,

    request_params

FROM system.access.audit

WHERE service_name = 'clusters'

  AND action_name = 'create'

ORDER BY event_time DESC

LIMIT 100;
This returns the last 100 cluster creation events, including who created them and when.
For Azure Databricks: diagnostic settings
If you haven’t migrated to Unity Catalog yet, configure audit logs through Azure Diagnostic Settings in the Azure portal. This routes log data to Azure Monitor, a storage account or Azure Event Hubs. Diagnostic log delivery requires the Databricks Premium plan. Audit events typically appear within 15 minutes of the activity.
For AWS: audit log delivery API
On AWS, configure audit log delivery via the Databricks account-level API to route JSON audit logs to an S3 bucket. Databricks delivers logs approximately every few minutes, with events typically logged within 15 minutes.
What audit logs capture:
- User authentication and session events
- Cluster creation, modification and deletion
- Data access events (who accessed which table or file)
- Job run starts and completions
- Notebook and workspace modifications
- Permission and configuration changes
Audit logs aren’t optional if your organization handles regulated data. GDPR, HIPAA and SOC 2 all require demonstrating who accessed what data and when; audit logs are your evidence. Set up automated retention policies on your storage layer to keep logs for the duration required by your regulatory framework.
Save up to 50% on your Databricks spend in a few minutes!
Conclusion
And that’s a wrap! Logging in Databricks notebooks is the foundation of operational observability in your data platform. Without it, debugging is guesswork, compliance is difficult and performance issues are invisible until they become outages.
Here’s a recap of the 10 best practices we covered:
- Implement logging with Python’s logging module
- Configure logging levels by deployment stage (DEBUG for development, WARNING/ERROR for production)
- Use structured JSON logging for machine-readable, tool-friendly output
- Write meaningful log messages that include context, inputs and outcomes
- Use ISO-8601 timestamps with timezone offset (%Y-%m-%dT%H:%M:%S%z) for consistency
- Periodically test your logging configuration to catch drift
- Store logs centrally—Unity Catalog volumes or cloud object storage, not DBFS root
- Implement error handling with try-except blocks and log exceptions with full context
- Integrate with a log analytics tool for search, alerting and visualization at scale
- Enable Databricks audit logs through system.access.audit or cloud-provider diagnostic settings
Start with Python’s logging module, add structure, centralize storage and add observability tooling as your workflows grow. The logs you build today are the ones you’ll rely on when something breaks in production.
… and so much more!
FAQs
What are the primary benefits of logging in Databricks?
Logging supports debugging, monitoring and audit trails which is core to observability and accountability in distributed data pipelines.
What formats are recommended for structured logging?
JSON is the recommended format. It’s machine-readable, parseable by Spark and compatible with most analytics tools.
How do I configure different logging levels in Python?
Use logger.setLevel(logging.<LEVEL>) where <LEVEL> is one of DEBUG, INFO, WARNING, ERROR or CRITICAL.
Can I automate testing of my logging configuration?
Yes. Write a test function that logs messages at each level, checks they appear in the expected destination and verifies formatting. Run it as part of your CI/CD pipeline or cluster startup script.
How do I get cluster logs in Databricks?
Access cluster logs through the cluster details page in the Databricks UI under the “Driver logs” tab. For long-term retention, configure log delivery to cloud storage (S3, Azure Data Lake Storage or GCS) from the cluster configuration.
What should I include in meaningful log messages?
Include timestamps, the operation that occurred, relevant inputs and outputs, severity level and (for complex systems) the function or module name.
Should I still use DBFS for log storage?
No. Both DBFS root and DBFS mounts are deprecated. Databricks recommends Unity Catalog volumes, external locations or workspace files. New workspaces don’t have access to DBFS features.
What’s the difference between notebook logs and cluster logs in Databricks?
Notebook logs capture events from code execution within a notebook…driver-side, for Python. Cluster logs include broader system and runtime information for the entire cluster, including JVM, Spark and OS-level events.
Can I log from Spark worker nodes in Databricks?
Python’s logging module only captures events on the driver node. To capture logs from Spark executors (worker nodes), configure Log4j2 properties on the cluster, or use Spark’s structured streaming event listeners and foreachBatch to collect executor-side information back to the driver.
How do I integrate Databricks logs with Azure Log Analytics?
Configure diagnostic settings for your Azure Databricks workspace in the Azure portal, select Azure Monitor as the destination and choose a Log Analytics workspace. This requires the Databricks Premium plan.
How do I access Databricks audit logs?
On Unity Catalog-enabled workspaces, query the system.access.audit table. On Azure, configure diagnostic settings to route audit events to Azure Monitor. On AWS, use the audit log delivery API to send logs to an S3 bucket.
What should I do if my logs aren’t appearing in my storage location?
Check that the cluster has write permissions to the path, verify the path syntax is correct (e.g., /Volumes/<catalog>/<schema>/<volume>/) and confirm the handler was correctly added to the logger without duplication. Also check that you haven’t accidentally set the handler’s log level higher than the logger’s level.
Can I use Databricks audit logs for compliance reporting?
Yes. Audit logs provide a record of user activities and system changes, making them suitable for GDPR, HIPAA and SOC 2 compliance reporting.
How do I handle sensitive information in logs?
Implement log masking or sanitization to remove sensitive fields before logging. For structured JSON logs, exclude sensitive keys from the log record dictionary. Never log passwords, API keys or personally identifiable information (PII) in plain text.
Does Python’s logging module work in Databricks serverless compute?
Python’s logging module works in serverless compute, but file-based handlers behave differently since the local filesystem is ephemeral. Use StreamHandler to capture output in notebook cells, or route logs to an external service like Azure Log Analytics or Datadog for persistent storage.