Cloud sustainability cuts cost and carbon when it’s built into an operating model
Sustainability is a compliance capability that’s become increasingly essential. Reporting requirements have expanded significantly over the past year, and they’re cascading through supply chains in ways that affect organizations regardless of where they’re headquartered. But it’s not enough to meet mandates like CSRD, CSDDD, CBAM in Europe and California’s SB 253 and SB 261. To provide real value to the business, you need to go beyond dashboards and reporting to the “double win” opportunities, where a single action cuts both spend and emissions.
Dashboards don’t reduce emissions. Operating models do.
To make the operating model successful, carbon must be measured, allocated, forecasted and governed with the same rigor that FinOps teams already apply to cloud spend. We call it “treating carbon like cash,” and the data suggests the industry is moving in this direction. The 2026 Flexera State of the Cloud Report found that for nearly a third of respondents, cost optimization and reducing carbon emissions are now equal priorities.
Most organizations have some form of cloud sustainability visibility today — a report, a quarterly slide, maybe a provider-generated summary that arrives weeks after the fact. The challenge isn’t seeing the data. It’s turning that data into a repeatable practice that drives sustainable cloud computing action, assigns ownership and produces measurable results over time. That’s “treating carbon like cash”.
Treating carbon like cash in FinOps
The phrase “treat carbon like cash” describes a specific operational shift for FinOps sustainability: applying the same financial discipline you already use for cloud spend to your organization’s carbon footprint.
When carbon is managed like a financial metric, you can:
- Allocate it to the teams, services and business units that generated it — creating the same ownership and accountability structures you use for cost
- Forecast it using historical trends and confidence bands, so you can plan ahead instead of reacting after the fact
- Set budgets and guardrails so sustainability targets are enforced with the same governance mechanisms as financial targets
- Prioritize work by return — comparing optimization opportunities not just by cost savings but by the combined impact on cost, carbon and water
This should be an extension of what FinOps teams already do. The cadence is the same (monthly reviews, optimization sprints, variance analysis). The accountability model is the same (ownership by team and account). The allocation mechanics are the same (tags, hierarchies, organizational structures). The only difference is that sustainability signals are now plugged into the same system of work.
And here’s the key insight: many of the optimization actions that reduce cost also reduce emissions. Rightsizing an oversized VM saves money and reduces energy consumption. Retiring a zombie workload that no one uses eliminates both the spend and the carbon footprint. Shifting a workload to a region with a cleaner energy grid may not change the cost much, but it can materially reduce emissions. When you can see both dimensions side by side, you can target these “double win” opportunities systematically instead of stumbling across them by accident.
So how do you make this model and reality in your organization? Whether you’re starting from scratch or looking to mature an existing sustainability practice, we’ve built a concrete path forward using the FinOps Foundation’s Framework with specific actions and checkpoints to gauge your progress and success.
Why the FinOps Framework works for cloud sustainability
If you’re familiar with the FinOps Foundation’s Framework, the structure of this playbook will feel natural. The Inform → Optimize → Operate cycle is the backbone of cloud financial management: build visibility, take action on what you find, then operationalize reporting and governance so the work sustains itself.
The same structure works for a cloud sustainability strategy with one important requirement. For sustainability metrics to fit into this framework, they need to behave like cost metrics. That means they need to be allocatable (tied to the teams and services that generated them), actionable (connected to recommendations that quantify impact) and repeatable (supported by reporting and governance that hold up month after month).
When sustainability data meets that bar, it stops being a parallel reporting effort and becomes part of the FinOps system of work. That’s the goal of this playbook.
Phase 1: Inform your cloud sustainability baseline (30 days)
Build a baseline you can defend
The first phase is about establishing clear, trustworthy visibility into your organization’s cloud sustainability footprint. You can’t manage what you can’t measure, but more importantly, you can’t manage what you can’t explain. The goal isn’t just to produce a number; it’s to produce a number you can defend, slice by any relevant dimension and use to answer, “what drove the change?” when someone asks.
Actions to take to establish your cloud sustainability baseline
- Connect your cloud billing data to sustainability metrics. Flexera One Cloud Sustainability uses your existing cloud billing data combined with auditable emissions factors from Flexera partner Greenpixie to generate carbon (CO₂e), energy and water metrics. This isn’t a separate data pipeline; it’s a sustainability layer built on top of the financial data you already trust
- Validate your allocation inputs. Sustainability data is only as useful as the organizational context around it. Review your accounts, subscriptions, tags, labels and organizational hierarchies to make sure they’re clean and consistent. The question you need to be able to answer is “who owns this?” Ownership is what turns a metric into accountability
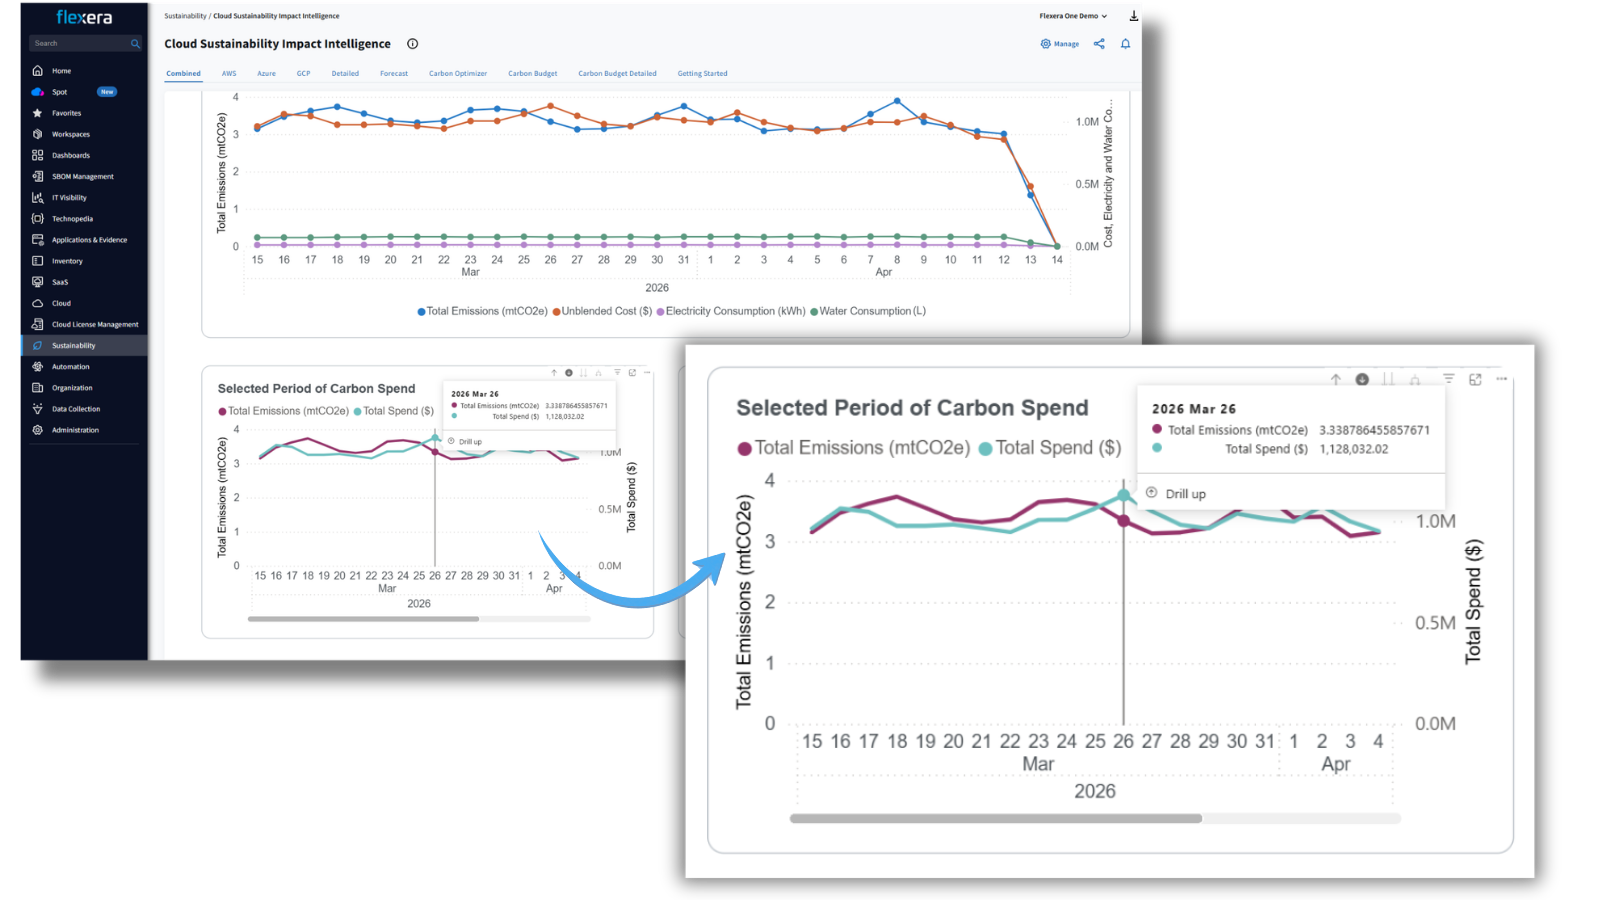
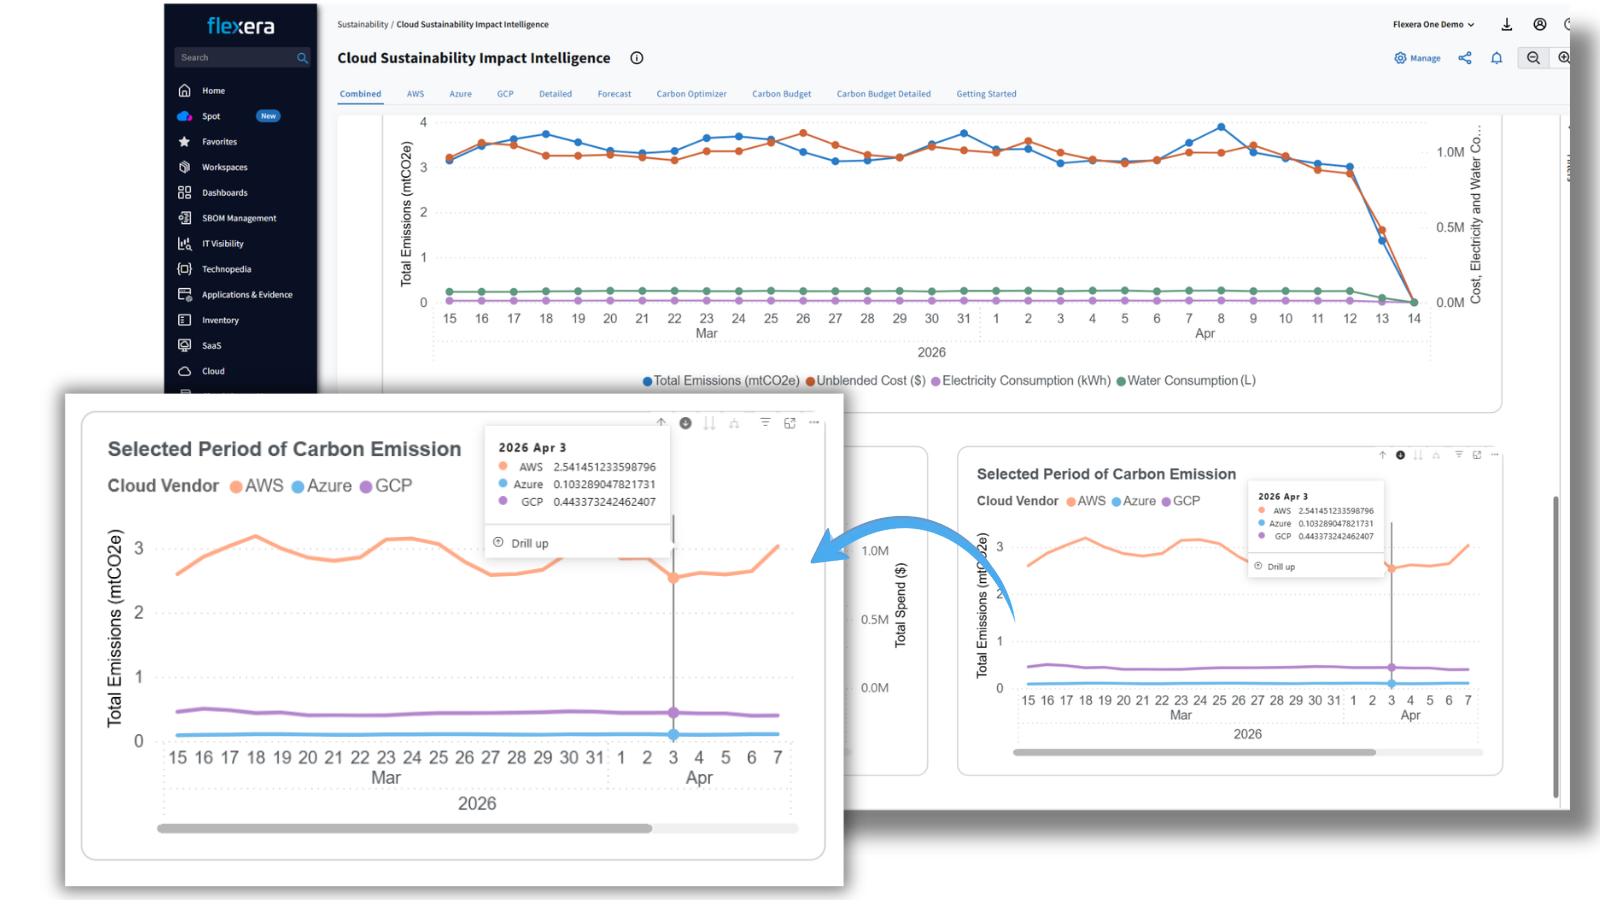
- Explore the carbon dashboards. Track CO₂e alongside cloud cost over time. Drill into the drivers by cloud provider, resource category and region. The goal at this stage is to understand the shape of your carbon footprint. Where is the carbon concentrated? Which services and regions are the biggest contributors? Are there surprises such as workloads that are modest in cost but significant in emissions?
- Identify your initial hotspots. Look specifically for always-on workloads (especially AI-related), high-density compute in carbon-intensive regions and any services where the sustainability footprint is disproportionate to the spend. These are the areas where Phase 2 optimization will deliver the most impact
- Set up organizational context for accountability. Add attributes like Azure subscription and resource group and use tag- and hierarchy-driven filtering to align sustainability reporting to the same structures you use for financial reporting. If your cost data is organized by business unit and team, your carbon data should be too
Flexera capabilities that give you cloud sustainability visibility
Flexera One Cloud Sustainability provides carbon dashboards that connect spend to impact, with the ability to track CO₂e alongside cloud cost and drill into drivers by provider, resource category and region. Organizational context features let you add attributes and use tag- and hierarchy-driven filtering to align sustainability reporting to your existing financial reporting structures. Enterprise-grade access patterns and the ability to extract sustainability datasets for downstream BI workflows (including Power BI) ensure the data is accessible at scale.
Checkpoint
Ask yourself: Can I explain, by team and service, what’s driving our carbon emissions this month and how that compares to last month? If the answer is yes, you’re ready for Phase 2.
Phase 2: Optimize for cost and carbon together (60 days)
Move from awareness to action
Phase 1 gave you the map. Phase 2 is where you start moving. The goal here is to execute a focused optimization sprint using recommendations that quantify both cost and sustainability impact, so you can target the “double win” opportunities where a single action reduces both spend and emissions.
This is also where the “carbon like cash” concept becomes most concrete. By applying a financial lens to carbon impact, you can compare different optimization opportunities using the same decision language your FinOps team and executive stakeholders already share.
Actions to take to quantify cost and sustainability impact
- Review the AI Carbon Optimizer Dashboard. This is where you see carbon impact alongside the cost optimization recommendations your team already trusts — rightsizing, waste reduction, scheduling and retirement. Instead of running cost optimization and sustainability optimization as separate workstreams, you’re seeing both dimensions of every opportunity in a single view
- Prioritize using a dual lens: cost savings plus sustainability impact. Not every optimization opportunity delivers the same ratio of cost savings to carbon reduction. Some changes save a lot of money but have minimal sustainability impact. Others are modest in dollar terms but eliminate outsized emissions. The “carbon like cash” approach lets you apply a financial lens to carbon impact so trade-offs are comparable and prioritization is grounded in a decision framework your organization already understands
- Target “small spend, big impact” opportunities. This is one of the most important and most overlooked categories. Traditional cost triage starts with the biggest line items and works down. But some resources sit below the cost threshold that would trigger attention, yet they run 24 hours a day, 7 days a week, and create outsized sustainability and compliance impact. Sustainability-aware recommendations in Flexera One surface these opportunities earlier, so they don’t stay hidden behind a “not worth my time” cost filter
- Hunt for zombie and ghost systems. Sustainability analysis is remarkably effective at surfacing forgotten infrastructure. Demo environments that were never torn down. Test VMs that outlived their project. Legacy workloads that no one uses but everyone assumes someone else owns. These systems continue to run, update, consume resources and generate emissions. They’re prime candidates for retirement, and eliminating them delivers immediate savings across cost, carbon and water
- Consider location-aware optimization. The carbon intensity of electricity isn’t uniform. It depends on where workloads run and the energy mix powering that region. A workload running in a region powered primarily by renewables has a materially different carbon footprint than the same workload running in a coal-heavy region, even if the cloud cost is identical. Where feasible, consider shifting or redesigning workloads to take advantage of cleaner grid regions. This is an optimization lever that cost-only analysis would never surface
Flexera capabilities that support carbon and cost optimization
The AI Carbon Optimizer Dashboard shows carbon impact alongside the cost optimization recommendations teams already run. The Carbon Impact Calculation Engine translates cost optimization opportunities into quantified environmental impact including carbon and water, making prioritization concrete and measurable. “Carbon like cash” prioritization applies a financial lens to carbon impact so teams can compare trade-offs using familiar decision mechanics. And the “small spend, big impact” detection surfaces resources that cost triage misses but sustainability analysis reveals.
Checkpoint
Ask yourself: Can our team compare a rightsizing opportunity against a workload migration — not just by cost savings, but by the combined impact on cost, carbon and water? If the answer is yes, you’re optimizing with a complete picture.
Phase 3: Operationalize cloud sustainability in FinOps (90 days)
Keep it running
Phase 1 built the baseline. Phase 2 delivered the first wave of optimization. Phase 3 is where sustainability becomes embedded in your FinOps operating rhythm rather than treated as a one-time sprint.
This is the phase that separates organizations that merely report on sustainability from organizations that manage it. The difference is the same as in FinOps for cost: the value isn’t in the initial cleanup; it’s in the ongoing discipline that prevents waste from creeping back and ensures progress compounds over time.
Actions to take to operationalize cloud sustainability
- Set up ongoing reporting for both practitioners and executives. FinOps engineers and cloud architects need operational views that are detailed, filterable, connected to the services and accounts they manage. Executive stakeholders need rollup summaries that show trends, progress against targets and the connection between optimization actions and sustainability outcomes. Flexera supports both levels, so you’re not maintaining two separate reporting systems
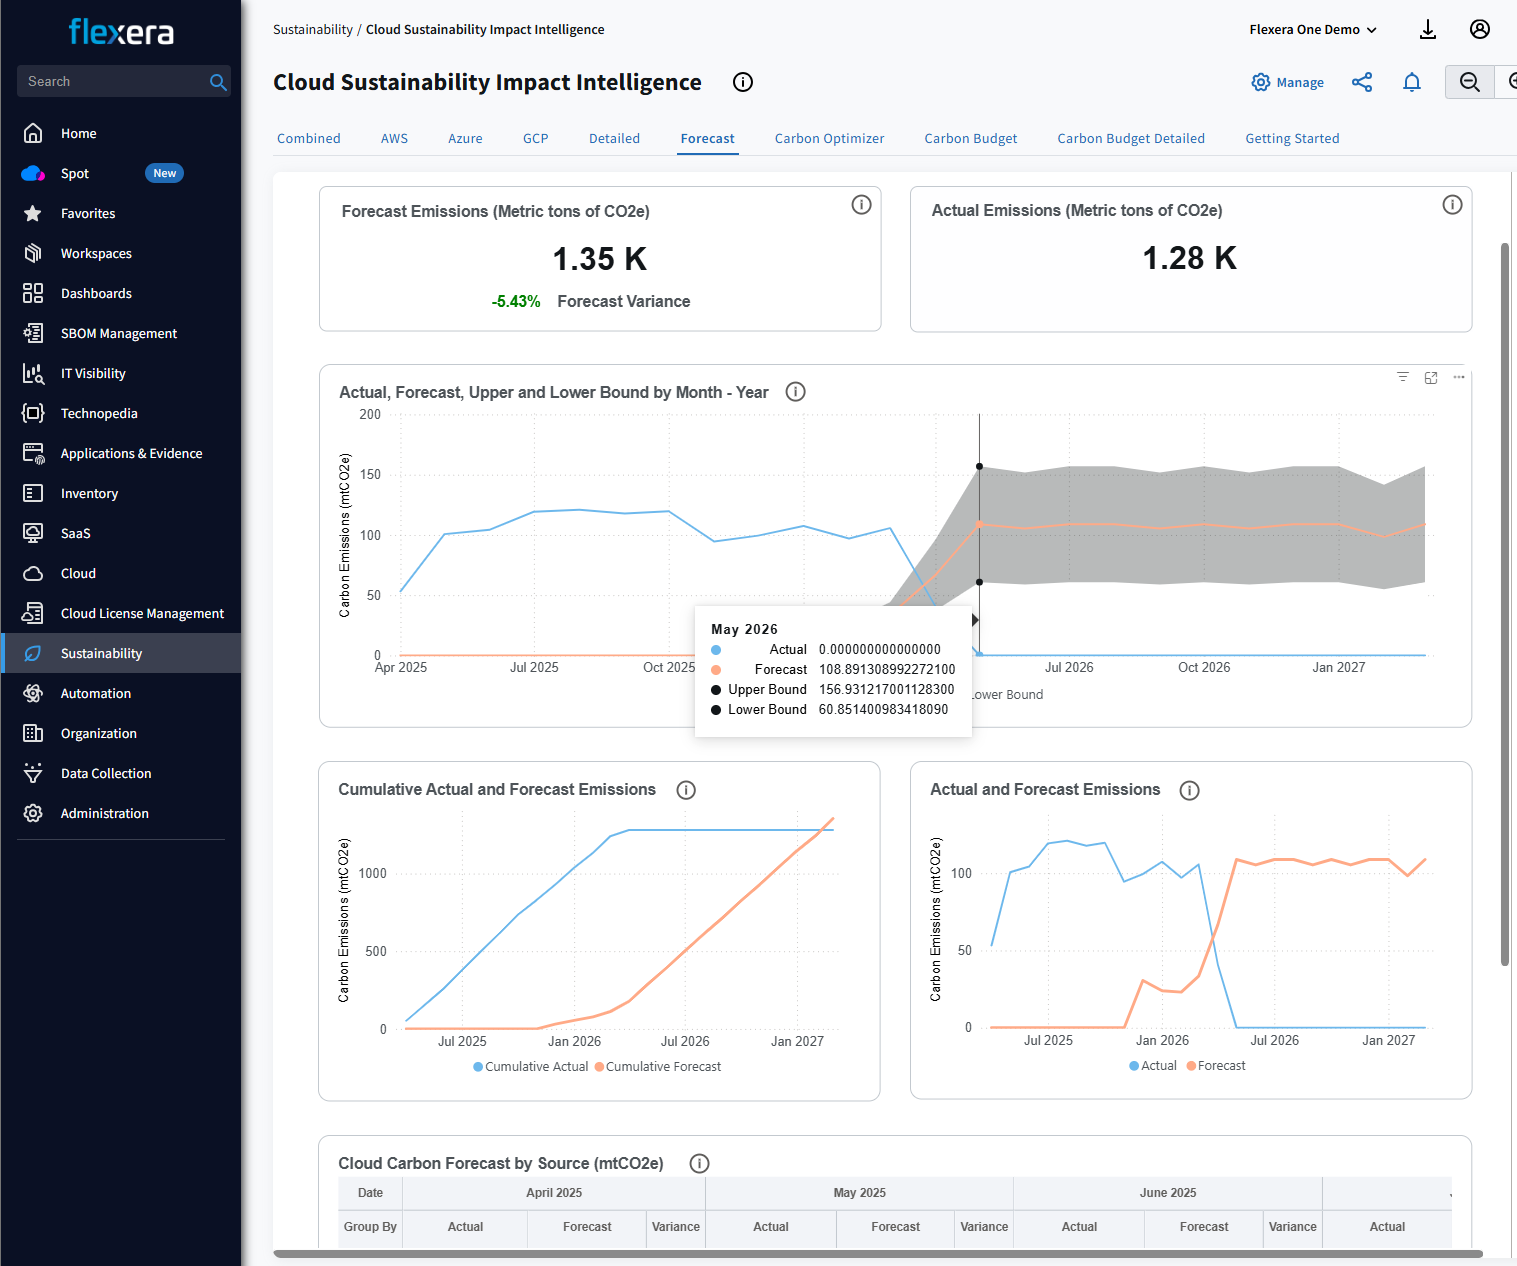
- Introduce forecasting. Backward-looking reports tell you where you’ve been. Forecasting tells you where you’re heading and whether you’ll hit your targets at the current trajectory. Flexera’s carbon forecasting uses auditable, confidence-banded trend visuals built from historical emissions data. This gives FinOps and sustainability leaders forward-looking signals, not just rearview reporting, and creates early warning when you’re drifting off track
- Add sustainability variance review to your monthly FinOps cadence. Just as you explain cost variance every month, you should be able to explain carbon variance. Did emissions increase because of legitimate growth, or because of waste? If they decreased, was it because of intentional optimization or because a team decommissioned a project? Building this habit is what turns sustainability from a metric on a dashboard into a managed dimension of cloud operations
- Define clear ownership. Align sustainability reporting to the same accountability structures you use for financial reporting. If a team owns their cloud cost, they should own their cloud carbon footprint too. This isn’t about creating new org structures. It’s about extending the ownership model you already have
- Build governance signals. Set targets, whether internal goals or externally aligned commitments, and create the guardrails and reporting cadence to track against them. Define what “good” looks like, establish the executive-ready summaries that support internal reporting and external compliance narratives, and make sure the data is auditable and defensible. This is increasingly important for organizations operating in or selling into markets with expanding sustainability disclosure requirements
Flexera capabilities that provide carbon forecasting
Flexera One Cloud Sustainability provides carbon forecasting with auditable, confidence-banded trend visuals. Reporting is built for both practitioners and executives, with operational detail views and leadership-ready rollups. Enterprise-grade performance supports high-volume analysis at scale. And the Flexera One platform is designed to align with the FinOps operating cadence and ownership models your team already runs.
Checkpoint
Ask yourself: If our CFO asked today, “Are we on track against our sustainability targets and what actions drove the change?”, could I answer in under five minutes? If the answer is yes, you’ve operationalized sustainability.
A 30-60-90 day cloud sustainability playbook at a glance
| Timeframe | Phase | Objective | Key Question |
|---|---|---|---|
| 30 days | Inform | Build a baseline that links spend to carbon, energy and water. Validate allocation inputs and identify hotspots. | Can I explain what’s driving our emissions by team and service and how it changed? |
| 60 days | Optimize | Execute a focused sprint using recommendations with both cost and sustainability impact. Prioritize “double win” opportunities using Carbon Like Cash. | Can I compare optimization options by combined cost, carbon and water impact? |
| 90 days | Operate | Operationalize reporting, forecasting, ownership and governance. Embed sustainability into the monthly FinOps cadence. | Can I answer “are we on track?” with defensible data in under five minutes? |
One important note: this isn’t a linear, one-time process. After 90 days, you cycle back to Inform — with a better baseline, tighter allocation, cleaner data and sharper questions. Each cycle compounds the value, just as it does in FinOps for cost.
Ready to start your own 30-60-90 Cloud Sustainability program? Request a demo to see how Flexera One Cloud Sustainability applies to your environment.