In the Flexera 2020 State of Tech Spend report we identified IT spending by industry across financial services, retail, healthcare, software, services, hosting, industrial and consumer products, transportation and logistics. We gathered IT spending data from 300 enterprise CIOs and IT executives in large and medium organizations in order to provide benchmarks against peer organizations for a variety of industries.
Contents:
IT spending by industry charts
- IT Spend by Industry
- Expected Change in IT Spend
- Breakdown of IT Spend by Industry
- Expected Change in On-Prem Software Spend
- Expected Change in SaaS Spend
- Expected Change in Number of Data Centers
- Expected Change in IaaS/Paas Spend
- Top 3 Priorities for Technology Initiatives
- Digital Transformation is “Top 3” by Industry
- Cybersecurity is “Top 3” by Industry
- Cloud is “Top 3” by Industry
- Employees in IT by Industry
- IT Spend Controlled by Business Units
IT spend by industry
The average IT spend across all industries was 8.2 percent of revenue. Unsurprisingly, software and hosting companies had the highest spend as compared to revenues. Financial services organizations also showed higher than average spend at 10 percent of revenue.
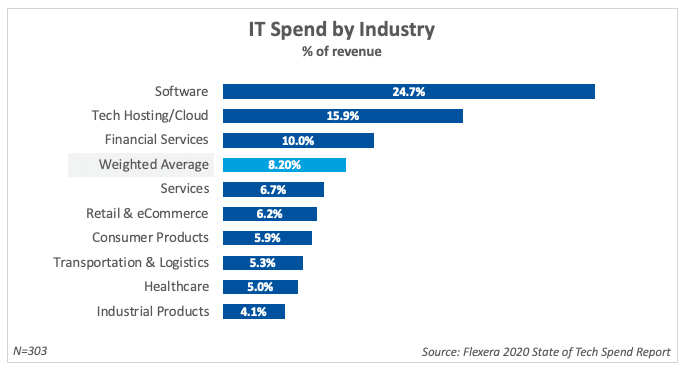
Software companies invest the most in IT at 24.7% of revenue—three times the 8.2% weighted average—while industries like healthcare (5.0%) and industrial products (4.1%) lag behind, highlighting wide variation in technology investment across sectors.
Trend: Change in IT spending by industry in 2020
Across all industries, 56 percent of organizations expected an increase in IT spend in 2020, compared to 20 percent expecting a decrease. However, there was significant variation by industry, with 85 percent of retail organizations planning to increase 2020 IT spend, more than double the 42 percent of consumer products companies planning to grow IT investments.
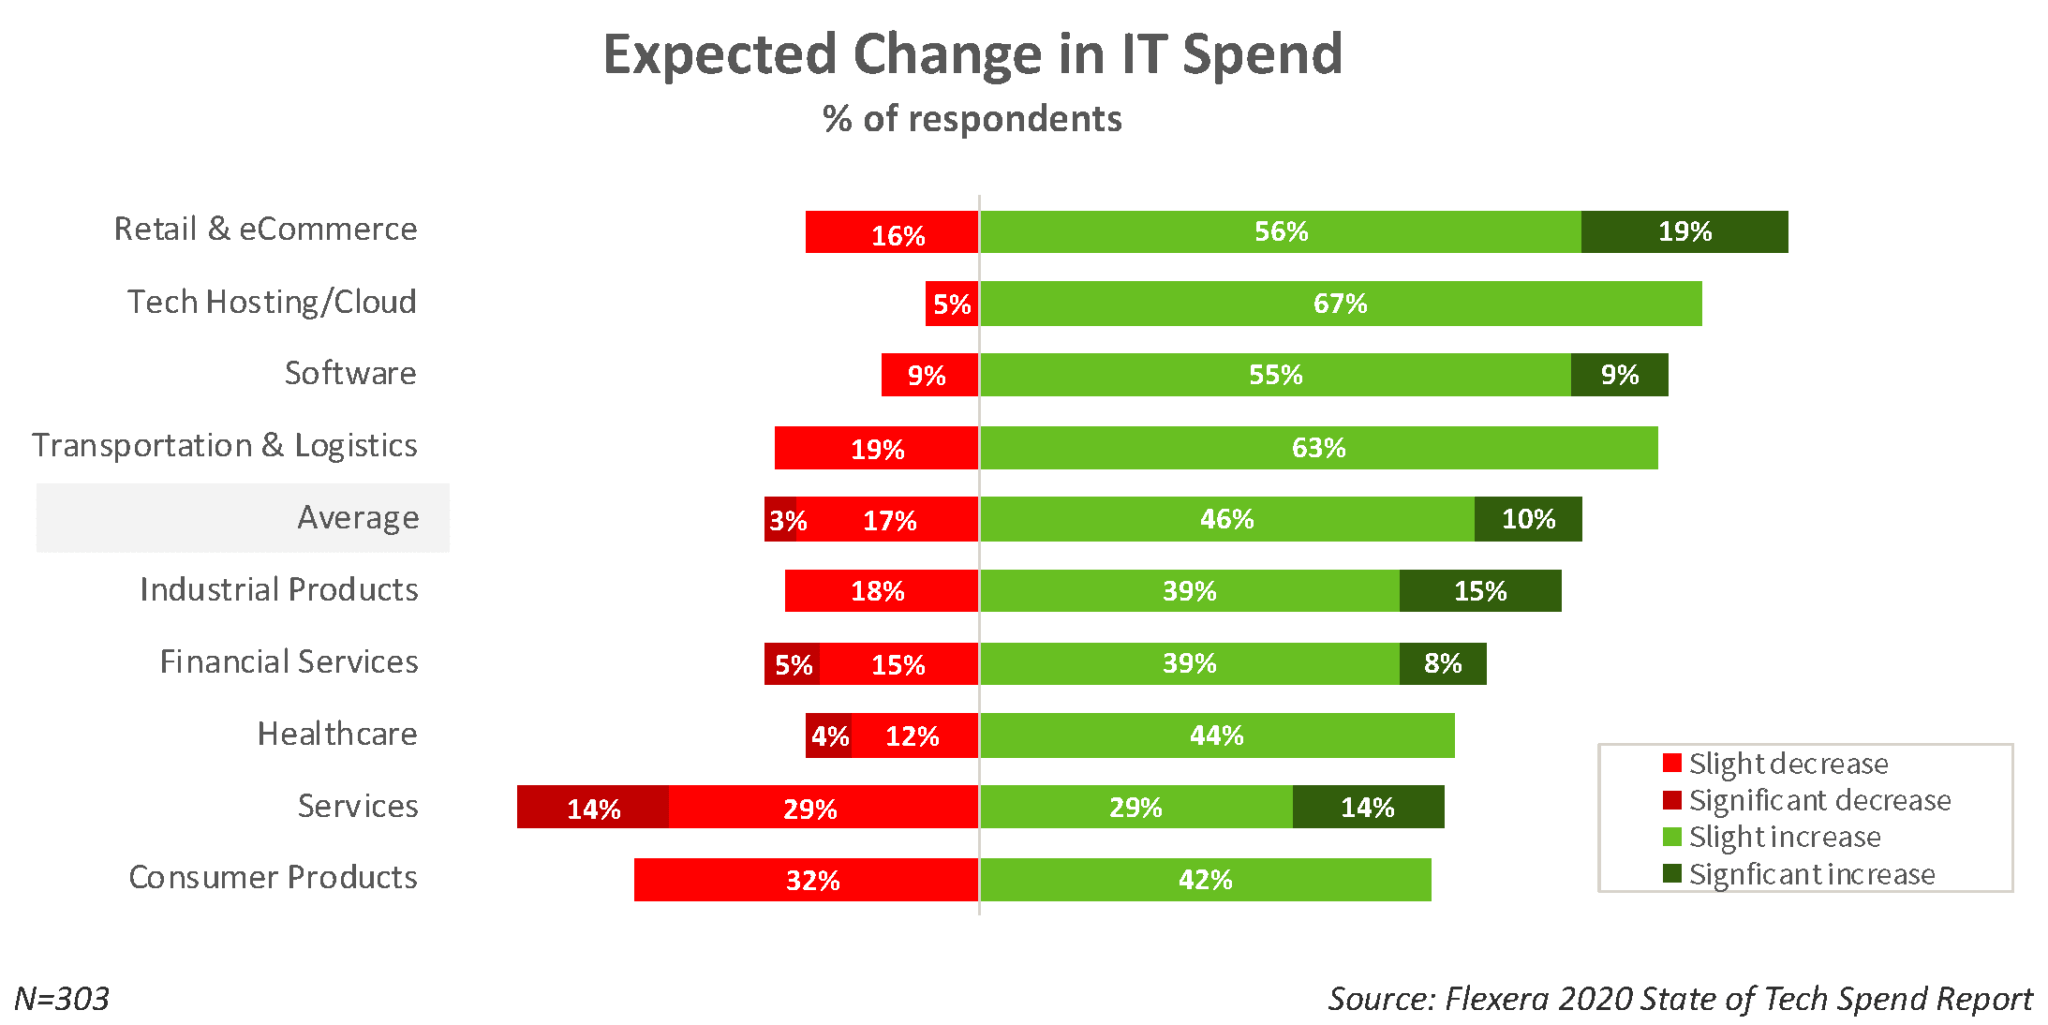
Tech hosting/cloud and retail/eCommerce lead expected IT budget increases, while consumer products and services brace for cuts—revealing a widening gap in technology investment priorities across industries as organizations reassess their IT spending strategies.
Software, SaaS, and cloud spend by industry
On average, almost half of IT budgets are allocated to a combination of on-premises software (22 percent), SaaS (7 percent) and IaaS/PaaS (18 percent). Together, the cloud spend across SaaS and IaaS/PaaS averages 25 percent. However, several industries spend more than 30 percent of IT budgets in cloud, led by healthcare at 33 percent, technology hosting (32 percent) and consumer products (32 percent).
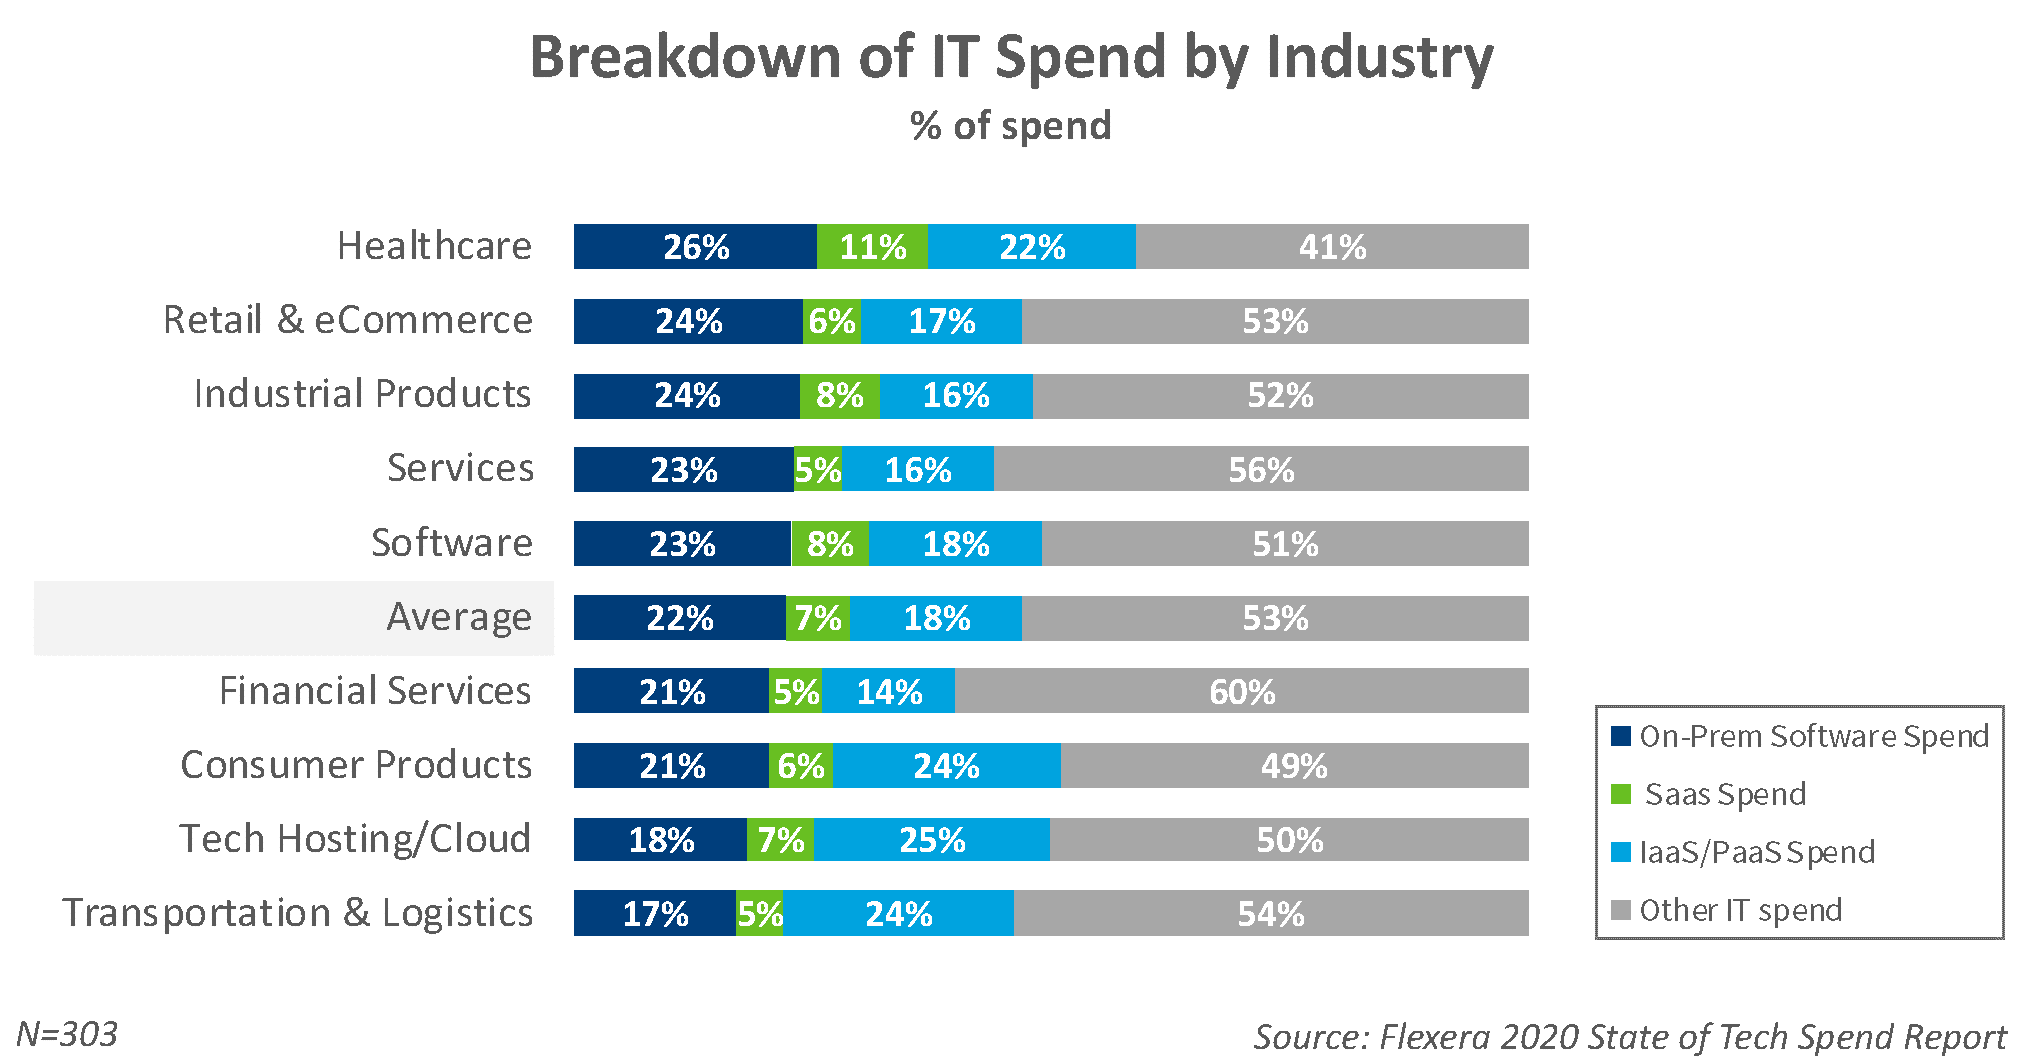
On-premises software still accounts for 22% of IT budgets on average, but IaaS/PaaS (18%) is closing the gap—with cloud-native industries like tech hosting (25%) and transportation (24%) leading the shift, while SaaS remains a modest 7% slice across all sectors.
Trend: Shift from on-premises software to SaaS
Organizations plan to shift spend away from software toward SaaS in 2020.
Change in on-premises software spending by industry in 2020
Across all industries, 55 percent of organizations are planning to decrease spend for on-premises software in 2020, compared to 23 percent expecting to increase. At the high end, 34 percent of retailers are growing on-premises software investments, while at the low end only 6 percent of transportation and logistics companies expect to grow software spend.
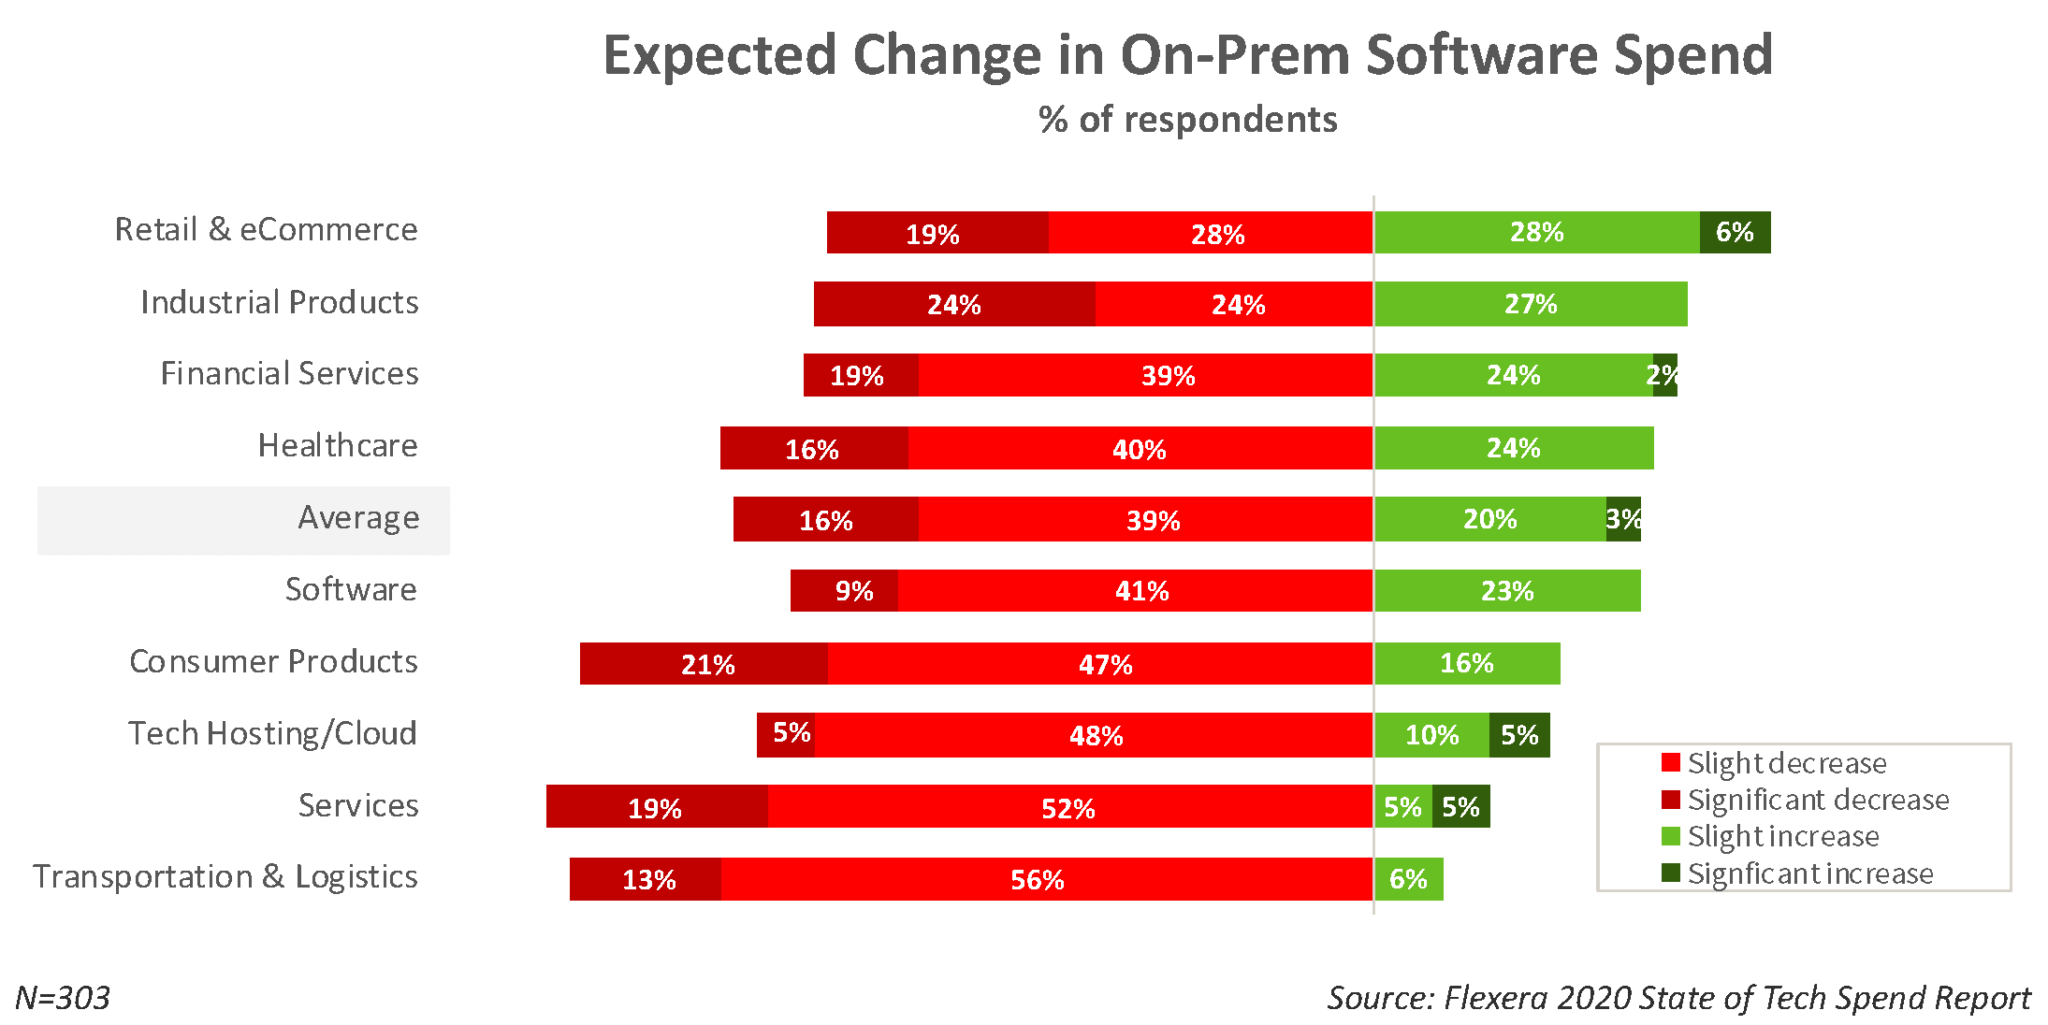
On-prem software spend is declining across the board—55% of organizations expect cuts on average, rising to 71% in services and 69% in transportation—as cloud migration and SaaS adoption accelerate the shift away from traditional software licensing models.
Change in SaaS spending by industry in 2020
In contrast to on-premises software, 81 percent of organizations across all industries expect to increase SaaS spend in 2020, with 28 percent expecting significant increases. Transportation and logistics companies are aggressively shifting from on-premises to SaaS, with 94 percent planning to increase SaaS spend. This aligns with their expectation of decreased spend for on-premise software.
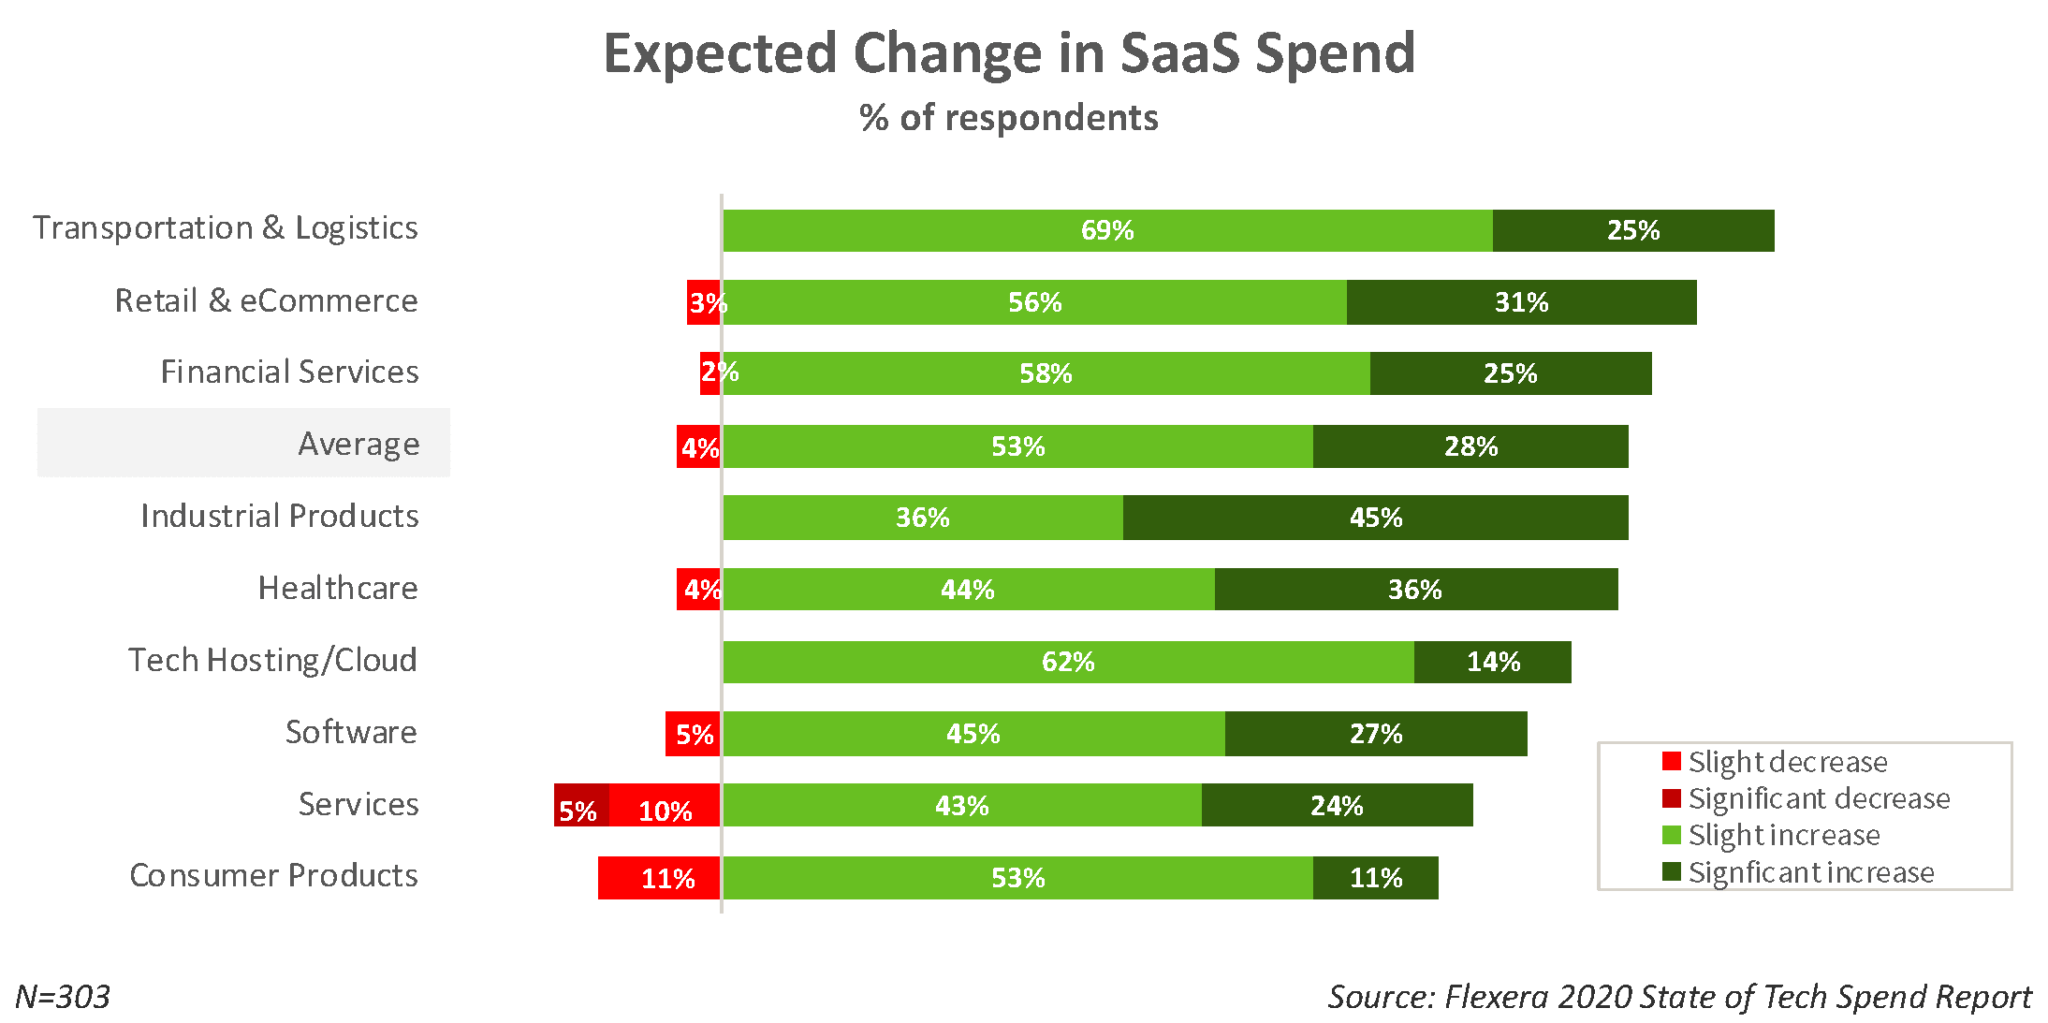
SaaS spending is surging across every industry—81% of organizations expect increases on average, led by transportation (94%) and retail/eCommerce (87%)—as the shift from on-premises software to cloud-delivered applications accelerates enterprise IT modernization.
Trend: Shift from data centers to public cloud
Similar to the shift from on-premises software to SaaS, enterprises are reducing their use of data centers as they move workloads to public cloud IaaS/PaaS.
Change in data centers by industry in 2020
Only 8 percent of organizations plan to increase their number of data centers in 2020, while 65 percent plan to decrease. Retail is leading the shift with 86 percent planning to shrink the number of data centers, followed by transportation and logistics with 82 percent decreasing data centers.

Data center footprints are shrinking fast: 65% of organizations plan to reduce capacity on average, rising to 86% in retail and eCommerce—highlighting the continued shift to cloud infrastructure and away from on-premises data centers.
Change in public cloud spending by industry in 2020
While the number of data centers will go down for most organizations, the use of public cloud will go up for 86 percent of organizations, with 41 percent expecting significant increases. Transportation and logistics companies are shifting quickly to IaaS/PaaS, with 100 percent planning to increase IaaS/PaaS spend and 50 percent planning significant increases. Transportation and logistics organization follow with 94 percent planning to increase IaaS/PaaS use.
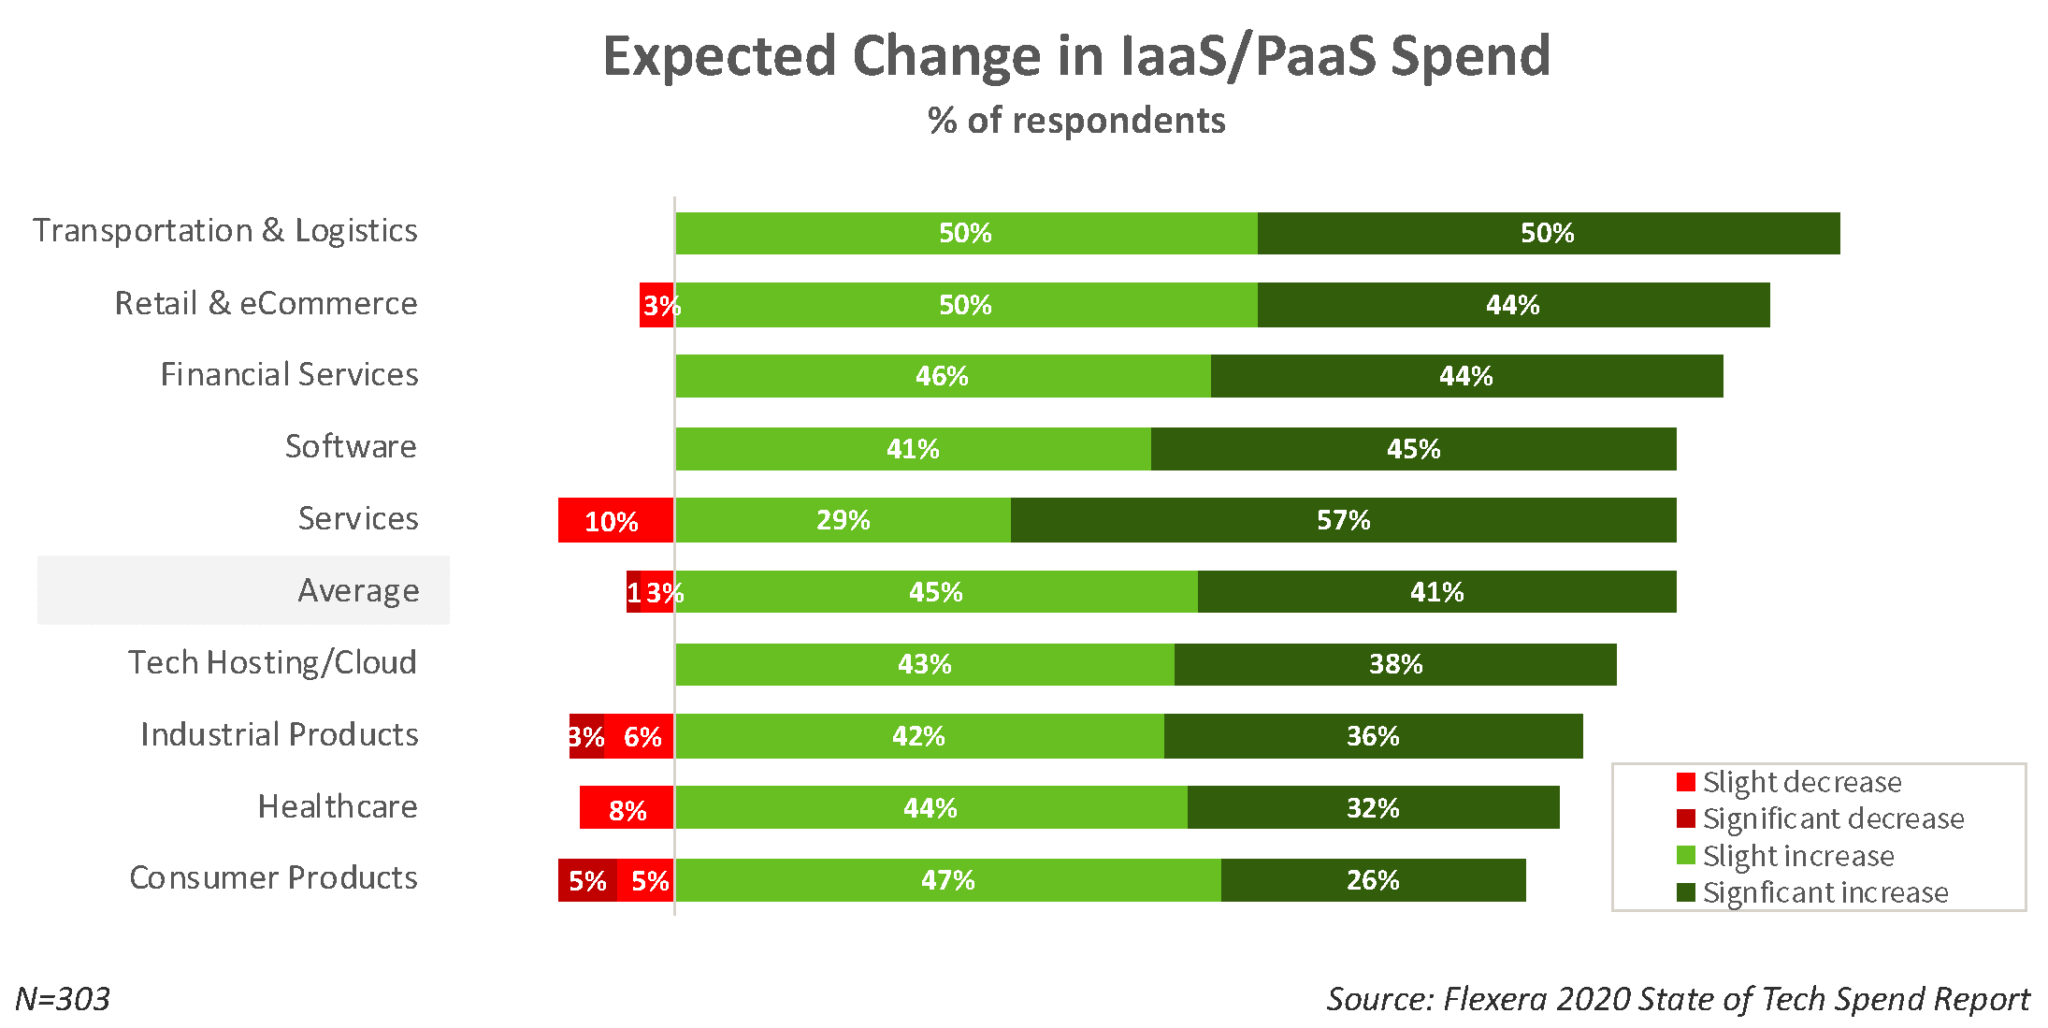
IaaS and PaaS spending is accelerating across every sector—86% of organisations expect increases on average, with many industries nearing universal growth—signalling continued investment in cloud infrastructure, platforms, and application modernisation.
2020 IT initiatives by industry
The 2020 State of Tech Spend report showed that across all respondents, the top three strategic initiatives were digital transformation, cybersecurity and cloud. However, the emphasis on those varied significantly by industry.
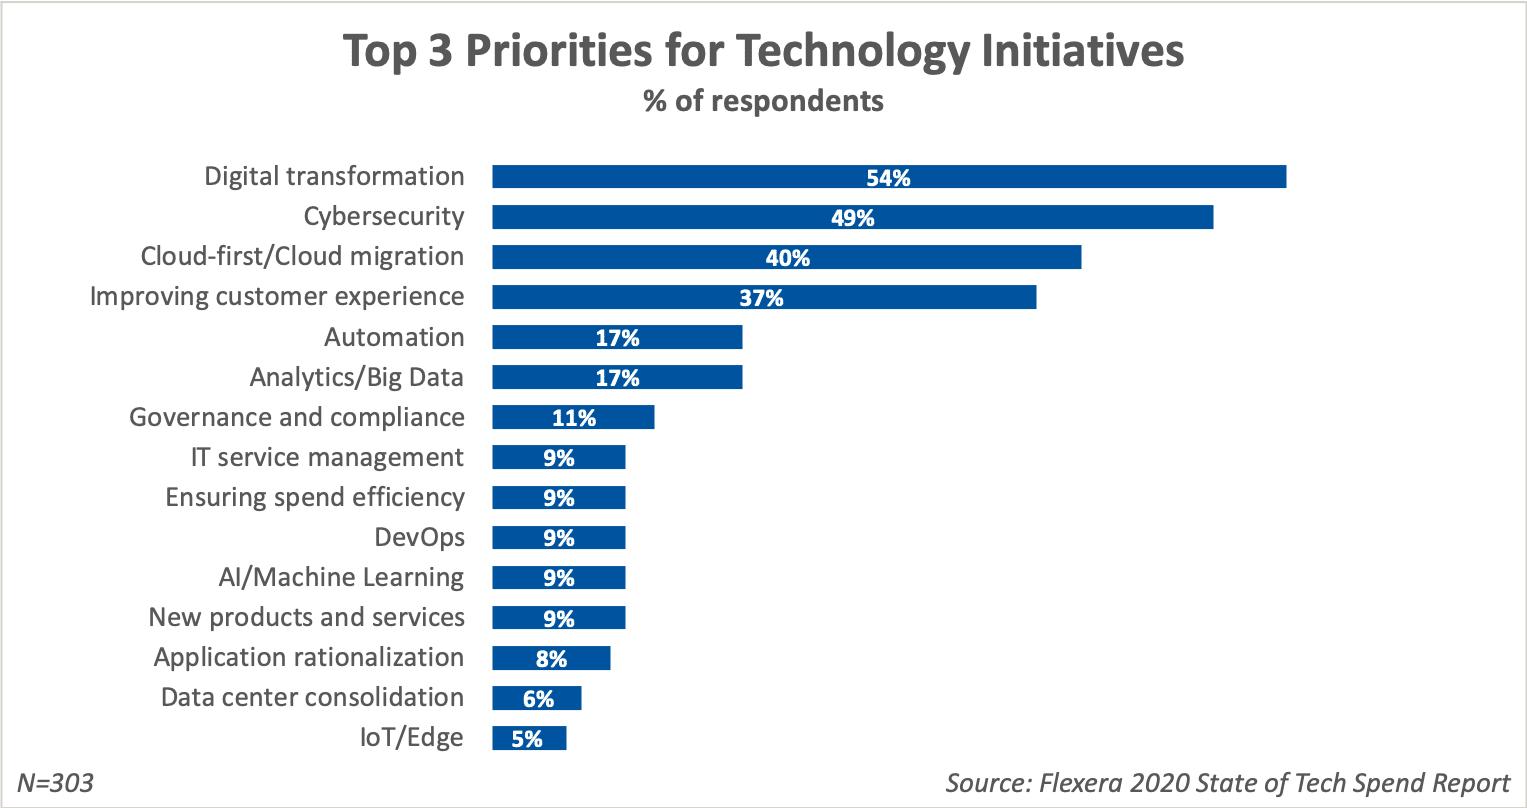
Digital transformation (54%) and cybersecurity (49%) top the list of technology priorities, with cloud migration (40%) close behind—highlighting how organisations are balancing innovation, security, and cloud adoption in their IT strategy.
Digital transformation initiatives by industry
Services organizations were most likely to focus on digital transformation, with 95 percent ranking it one of their top three initiatives. Consumer products organizations (74 percent) and retailers (69 percent) were also significantly more likely to cite digital transformation as a top initiative. Both of these industries are facing significant competition from online retailers and are focusing on a variety of technologies to help them improve digital and multi-channel customer experiences. Transportation and logistics are focusing on how to make last-mile delivery more cost effective.
Technology hosting and software companies were the least likely to focus on digital transformation, as many of these organizations have already made the shift to digital.
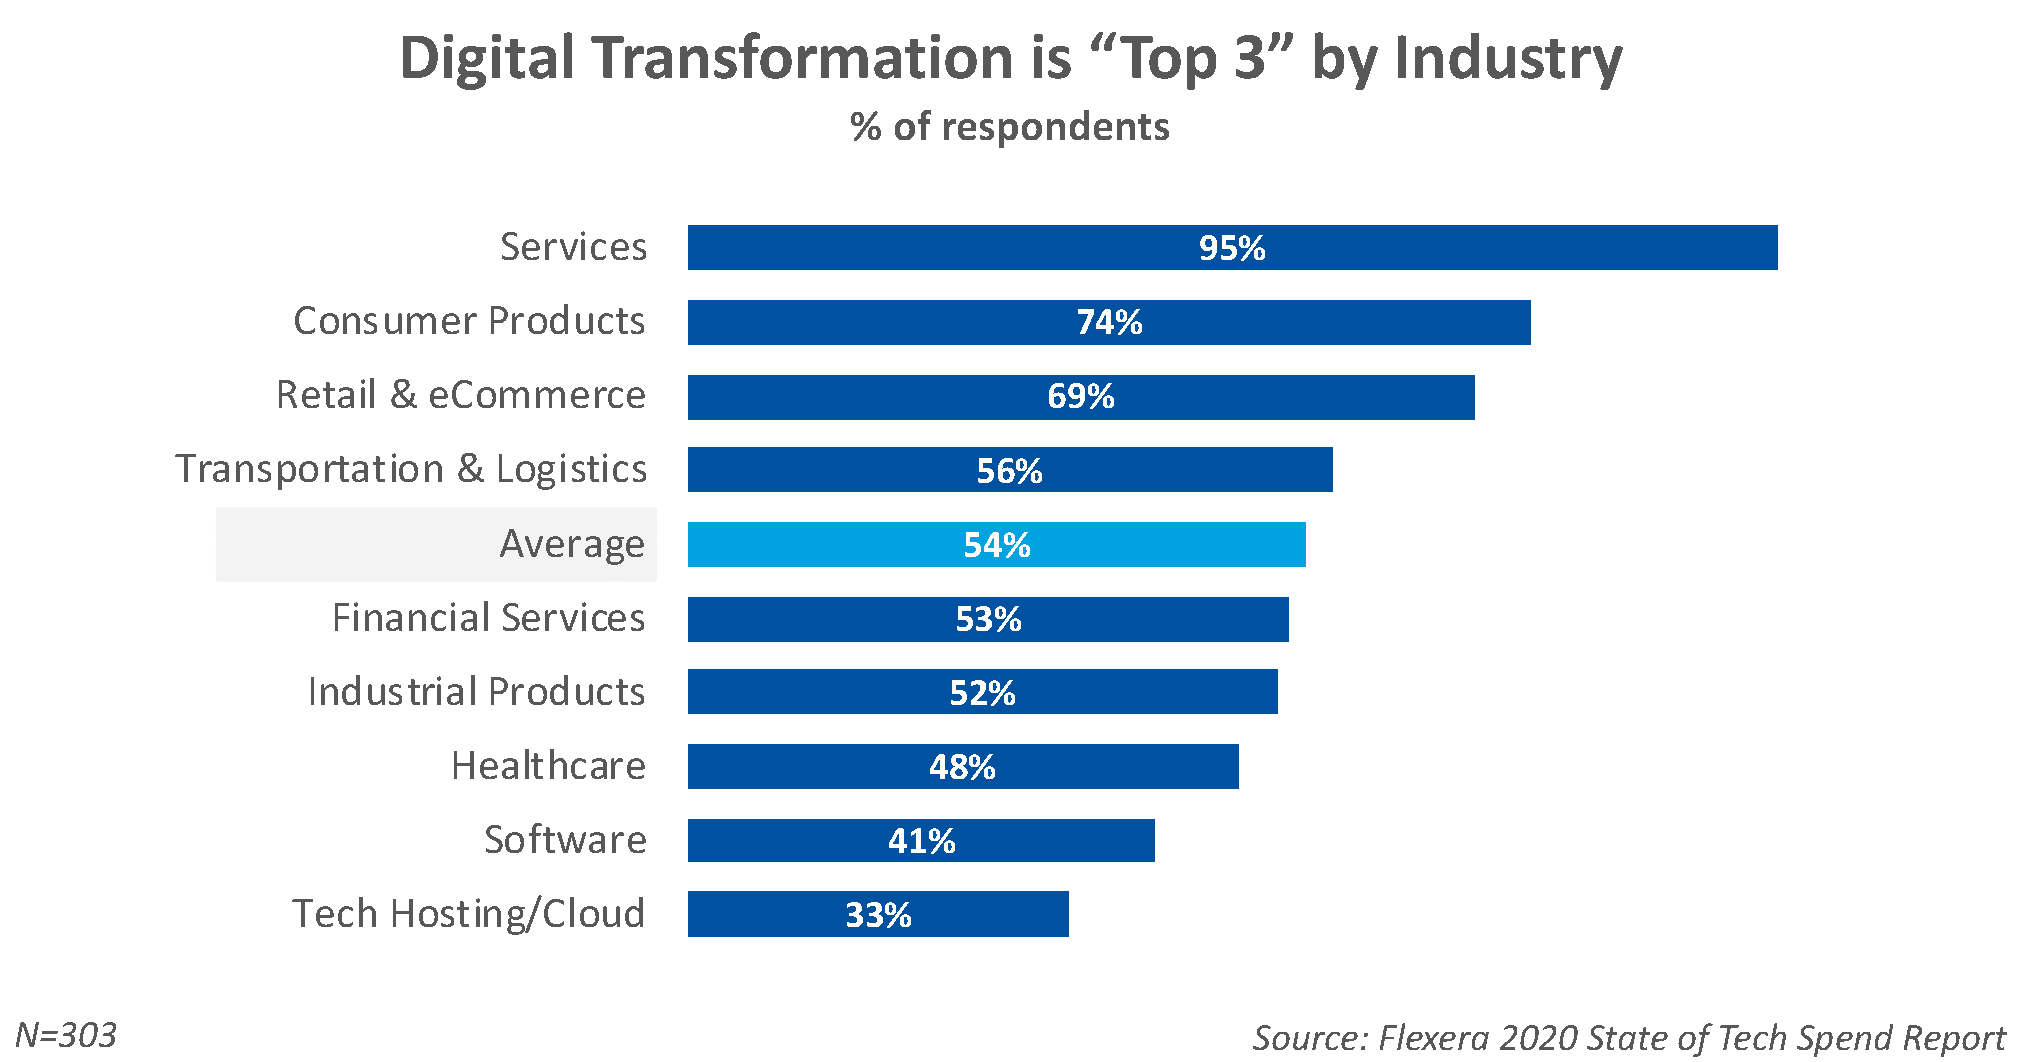
Digital transformation dominates across industries—ranking as a top-three priority for 95% of services organisations and 74% of consumer products—reinforcing its role as the cornerstone of modern IT strategy.
Cybersecurity initiatives by industry
Industrial products (61 percent), healthcare (60 percent) and financial services (56 percent) organizations were most likely to rank cybersecurity among their top three initiatives. Surprisingly, given several high-profile security breaches of customer data, only 31 percent of retailers reported cybersecurity as one of their top three focus areas.
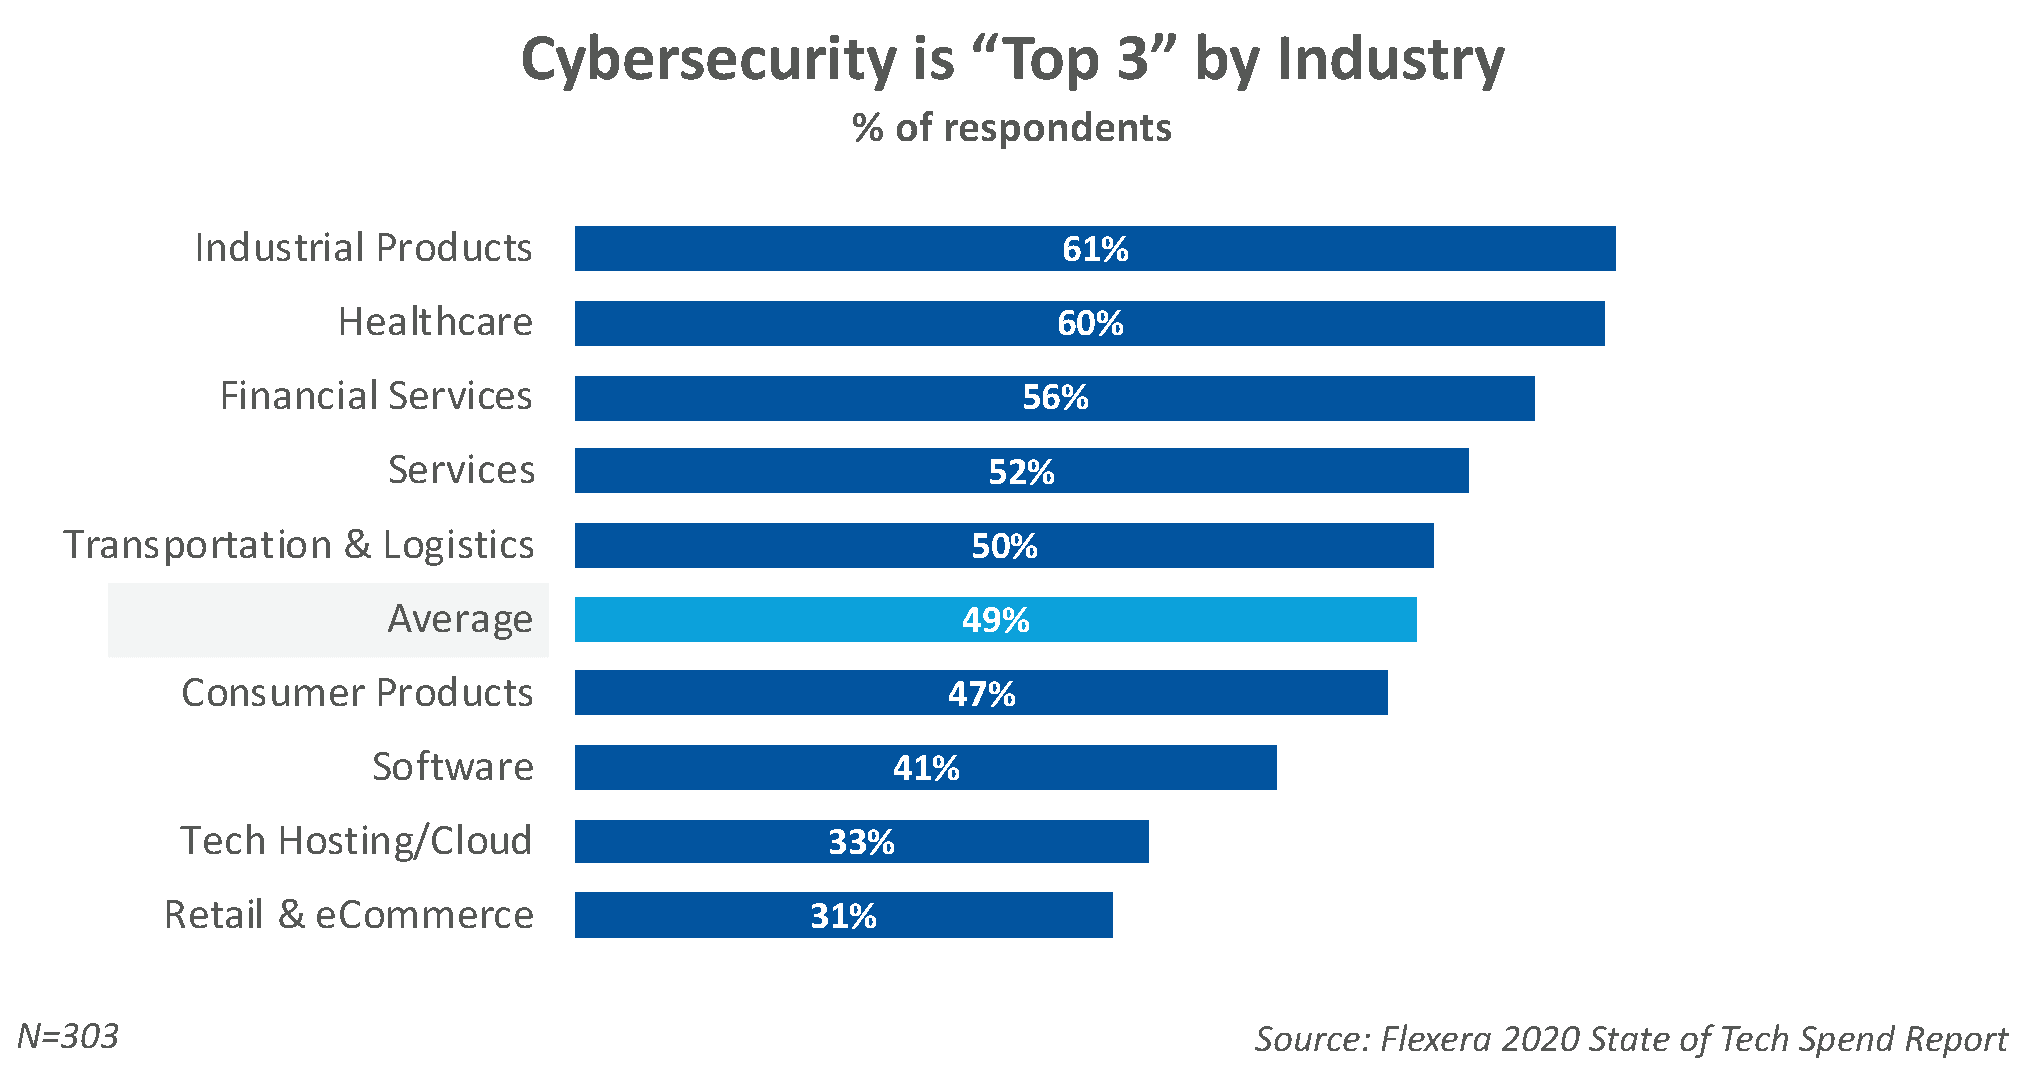
Cybersecurity is a top-three priority for nearly half of organisations (49%), with industrial products (61%) and healthcare (60%) leading—underscoring the growing importance of security in modern IT and cloud strategies.
Cloud initiatives by industry
Technology hosting (67 percent) and software companies (59 percent) lead the pack in citing cloud as one of their top three initiatives. They are followed closely by retail (47 percent), healthcare (44 percent) and services (43 percent) industries, with a higher than average focus on cloud. Conversely, only 31 percent of transportation and logistics companies were focused on cloud initiatives, a seeming contradiction with their first-place position in the expected growth in IaaS/PaaS and SaaS spend.
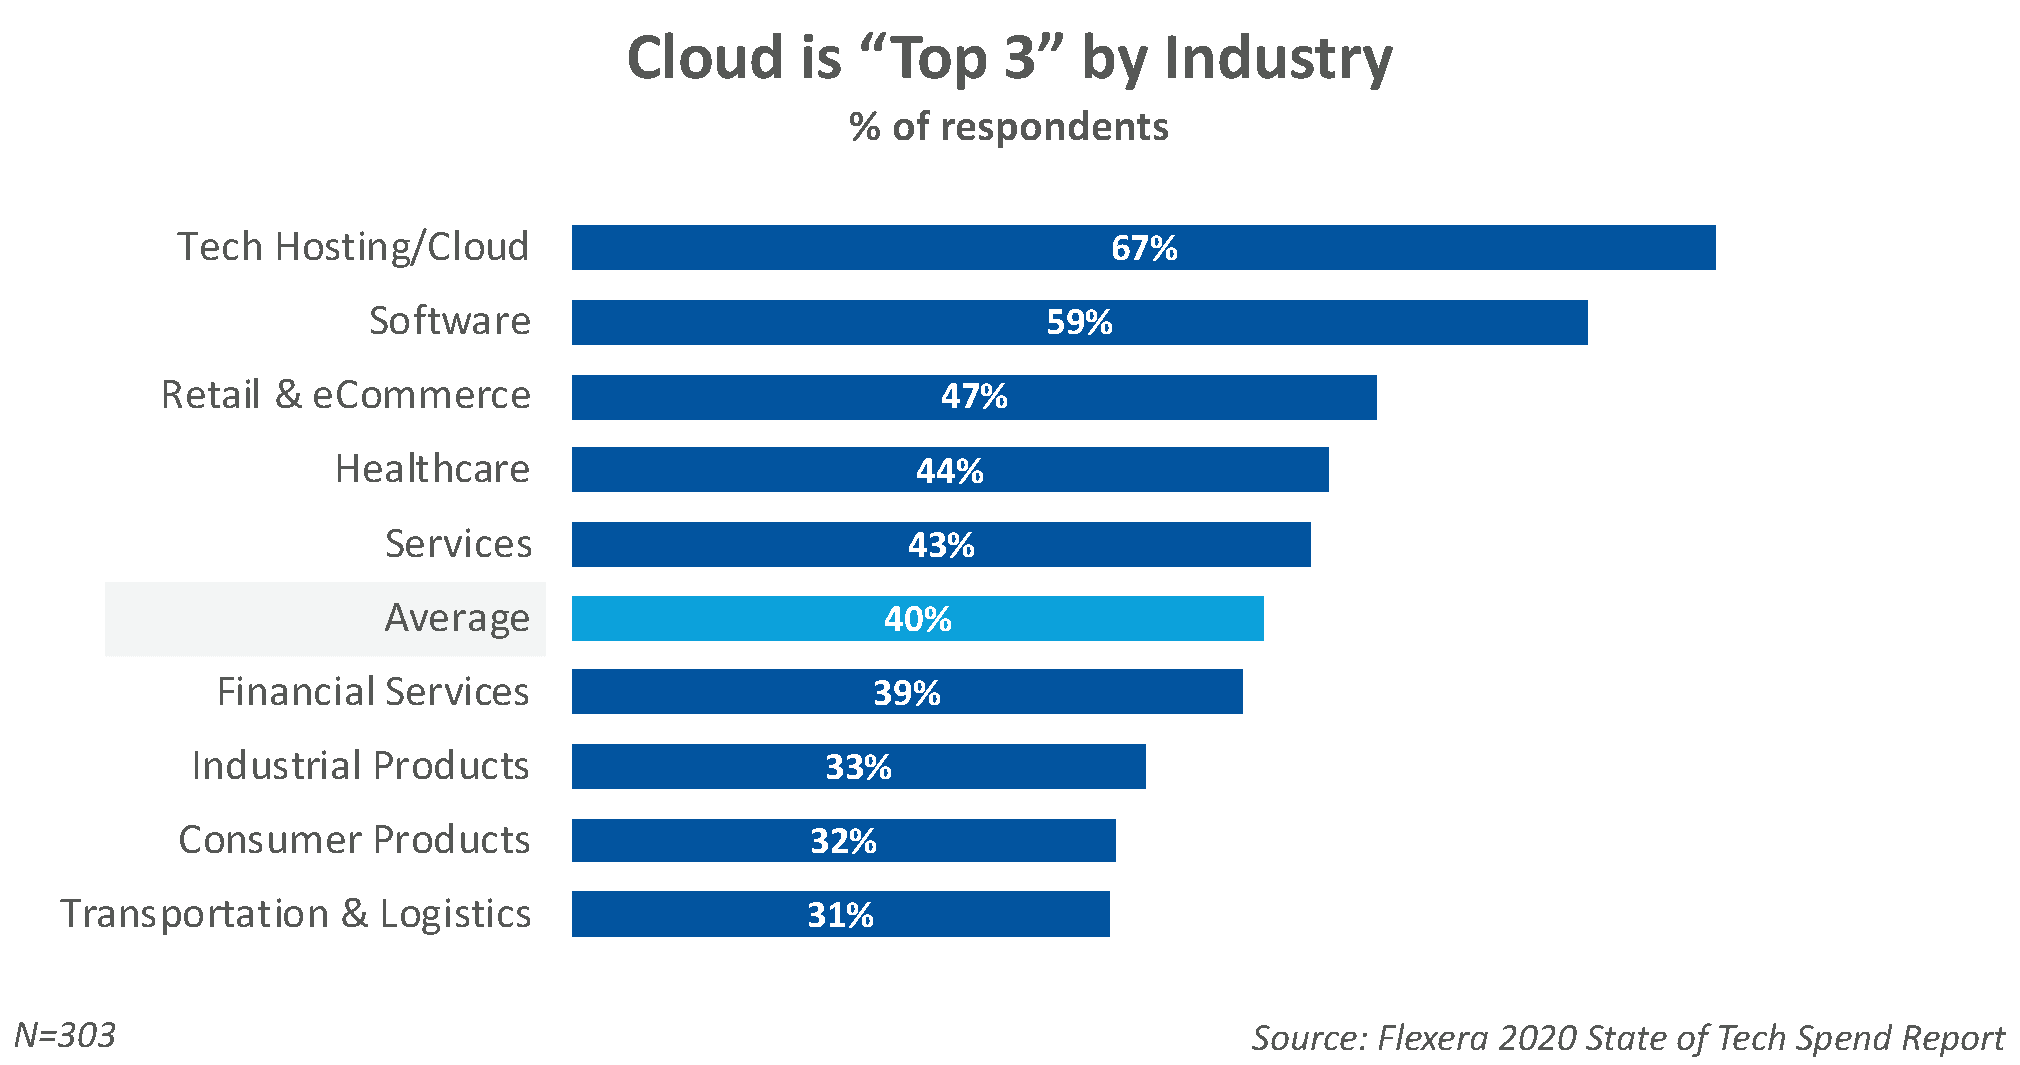
Cloud is a top-three priority for 40% of organisations on average—rising to 67% in tech hosting and 59% in software—highlighting the continued shift toward cloud-first strategies across industries.
Percentage of employees in IT by industry
On average, organizations reported 13.8 percent of employees were in the IT function. Technology hosting (41.5 percent), software (36.5 percent ), financial services (16 percent) and services (14.2 percent) companies showed higher than average numbers of IT employees. Consumer products and healthcare organizations were just below the average with 12.4 percent and 11.6 percent of employees in IT respectively, while retail, transportation and logistics and industrial products industries were below 7 percent.
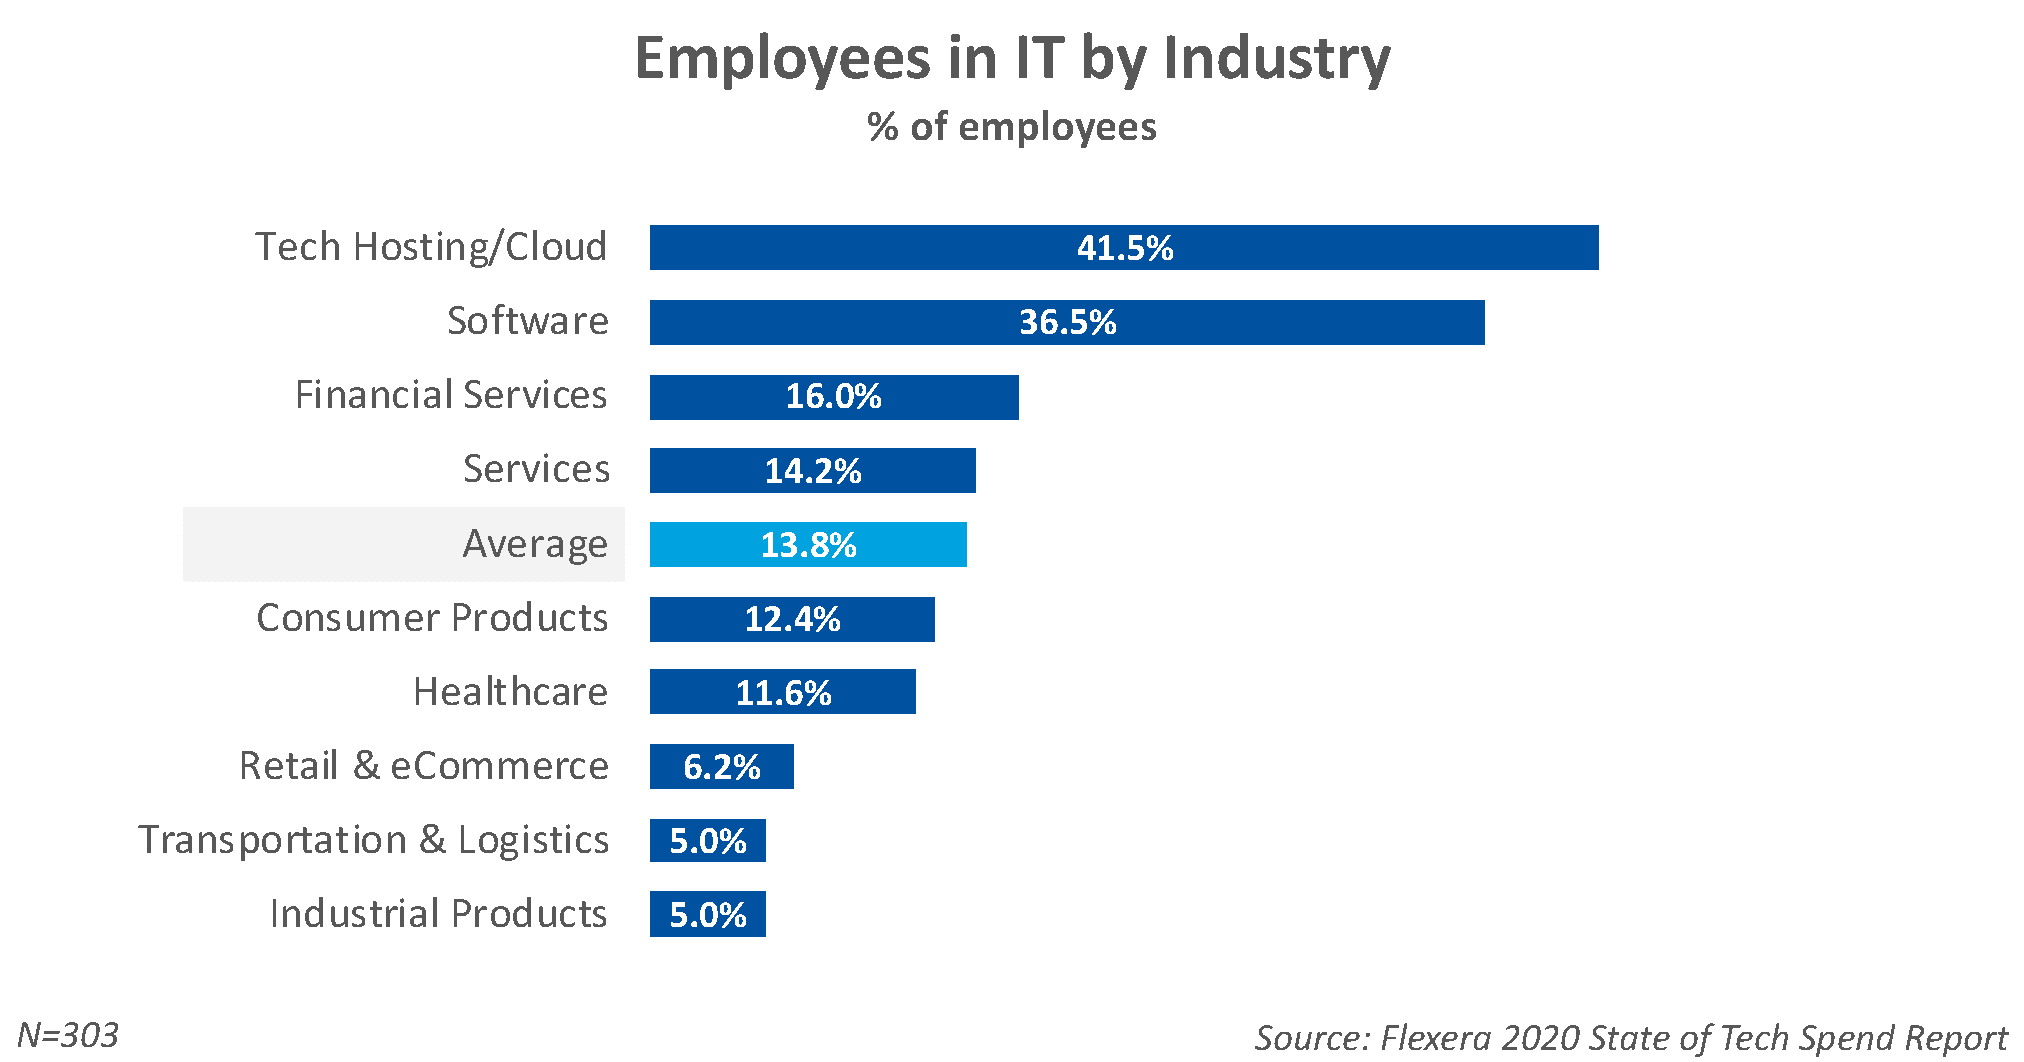
IT teams are largest in cloud and software companies—reaching 41.5% and 36.5% of employees—while most industries average just 13.8%, highlighting a significant talent gap as organisations scale digital and cloud initiatives.
Decentralized and shadow IT spend by industry
In most large organizations, business units control a portion of IT spend which often includes shadow IT. The 2020 State of Tech Spend report found that 26 percent of IT spend was controlled by business units, but that increased to 28 percent for organizations with more than 10,000 employees. However, technology hosting, software and financial services organizations reported that 34 to 35 percent of IT spend is decentralized and controlled by business units.
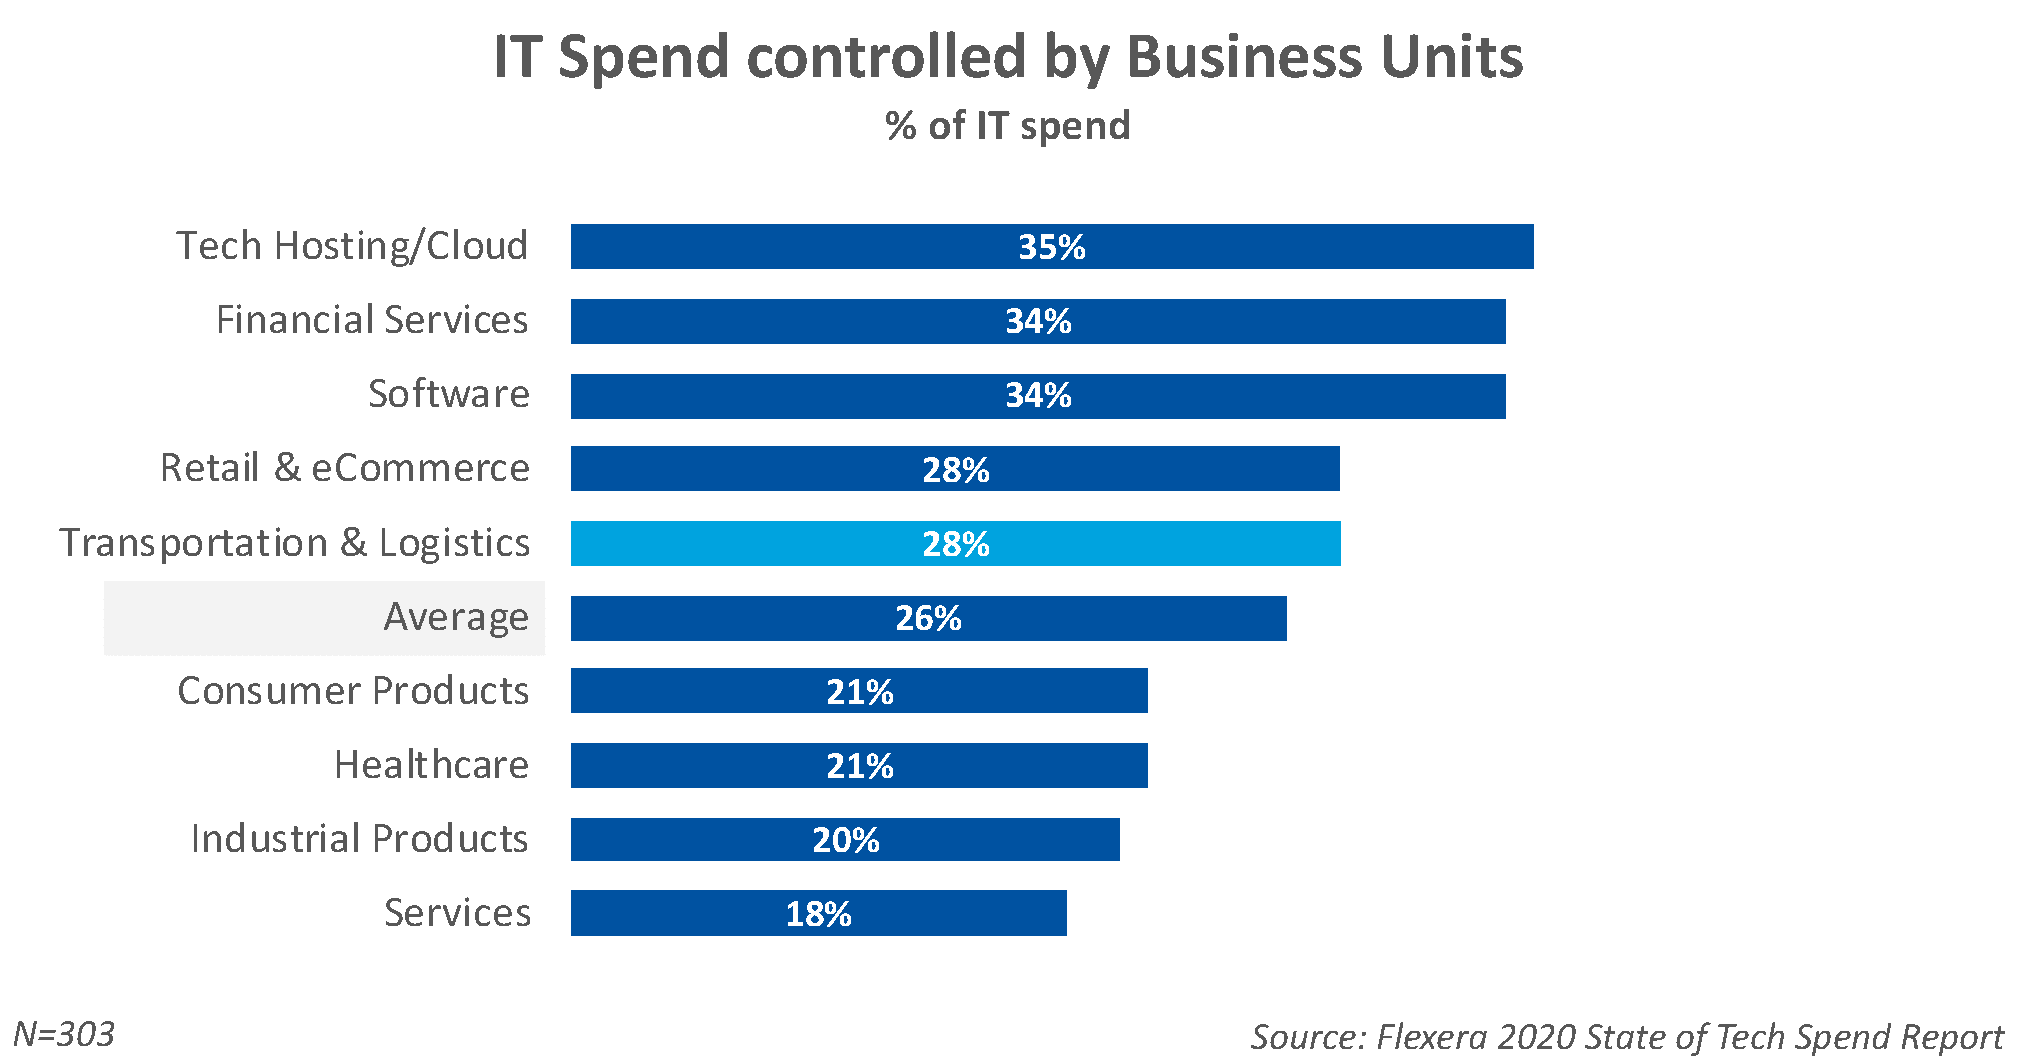
Business units control a growing share of IT spend—averaging 26% overall and rising to 35% in cloud-focused organisations—highlighting the shift toward decentralised IT governance and “shadow IT” influence across industries.
Summary:
We found that most organizations plan to increase IT spend in 2020. Digital transformation is a key driver of technology spend, with companies planning to make larger investments in SaaS and public cloud next year. Most companies are planning to decrease their use of data centers and on-premises software to fund this shift. Organizations can also reduce wasted technology spend by optimizing their use of software, SaaS and cloud.
Download a full copy of these charts.
Methodology
This IT spend-by-industry data came from the Flexera 2020 State of Tech Spend Report. The report was based on 303 responses from a validated panel of IT executives. Per-industry data is provided for industries with more than 15 respondents. Weighted-average data incorporates data from all 303 respondents, including industries with 15 or fewer respondents.
The count of respondents in each industry is shown below.
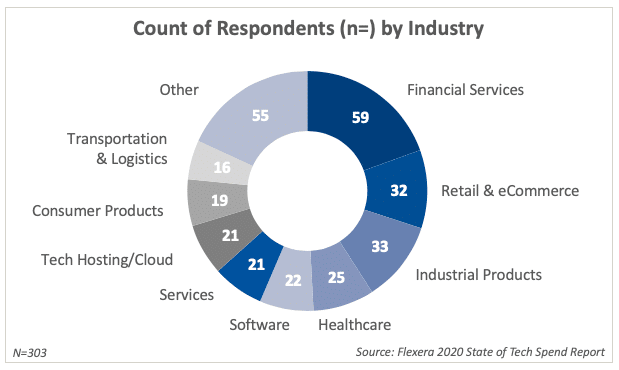
Financial services (59 respondents) and “other” industries (55) make up the largest share of survey participants, providing a broad cross-industry view of IT spending and technology trends.
Full demographics for the respondents are available by downloading the Flexera 2020 State of Tech Spend Report.