As cloud data warehouses become the backbone of modern analytics, more organizations are adopting Snowflake. However, using Snowflake at scale makes it imperative for data teams to have deep visibility into costs and performance.
In this article, we review the 5 best tools for Snowflake observability. These solutions help data teams track spending, optimize queries and significantly reduce Snowflake costs. Let’s dive in!
What is Snowflake observability?
Observability, at its core, is the ability to understand the internal state of a system by examining the data it produces. For traditional software systems, that means logs, metrics and traces. For a data warehouse like Snowflake, it means understanding credit consumption, query performance, storage usage and pipeline health well enough to diagnose root causes.
Snowflake observability specifically covers monitoring the health and performance of a Snowflake instance. Done right, it gives data teams visibility into how their warehouse behaves, helps them identify inefficient queries, detect cost anomalies and optimize resource utilization. The end result: lower bills, faster pipelines and fewer surprises.
It’s worth distinguishing observability from monitoring. Monitoring tells you that something is wrong. Observability tells you why. A dashboard that shows a spike in credit usage is monitoring. A tool that traces that spike back to a specific rogue query run by a specific user at 2 a.m. in the morning on a LARGE warehouse that should have been auto-suspended, that’s observability. (Read more on Observability vs Monitoring).
5 best tools for Snowflake Observability
1) Snowflake Resource Monitors (and Budgets)
Resource monitors are Snowflake’s own native cost-control mechanism. They’re the only Snowflake-native tool that can actively suspend virtual warehouses when credit consumption hits a defined threshold.
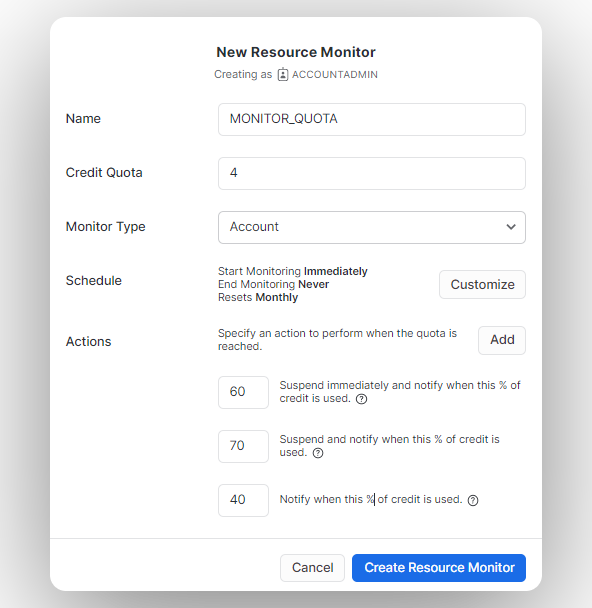
Here’s how they work: an account administrator sets a credit quota for a given monitoring interval (daily, weekly, monthly or a custom date range). When a warehouse crosses a percentage threshold you define, the monitor triggers a configured action. That action can be an email alert, a warehouse suspension or an immediate suspension with no grace period.
Key features of Snowflake Resource Monitor:
- Credit quota enforcement at the account or warehouse level
- Configurable triggers at multiple thresholds (e.g., alert at 75%, suspend at 90%, immediately suspend at 100%)
- Reactivation by increasing the credit quota or waiting for the next monitoring interval to reset
- Account-level monitoring (one account-level Resource Monitor per account) or warehouse-level monitoring (one Resource Monitor per warehouse)
- Email alerts when thresholds are reached
For serverless cost control, Snowflake now provides Budgets as a separate, complementary feature. Budgets operate on a calendar-month cycle and monitor credit usage across supported objects and serverless features. Unlike Resource Monitors, Budgets send notifications when projected spending is expected to exceed a limit, rather than reacting after a threshold is crossed. They can push notifications to email, Amazon SNS, Azure Event Grid, Google Cloud Pub/Sub or webhooks for Slack, Microsoft Teams and PagerDuty.
A note on access: Only users with the ACCOUNTADMIN role can create Resource Monitors. Account administrators can then grant MONITOR and MODIFY privileges to other roles so non-admin users can view and modify them. For Budgets, Snowflake provides dedicated application roles including BUDGET_ADMIN and BUDGET_VIEWER.
One more limitation worth flagging: Native Resource Monitor alerts only support email delivery. If your team wants those alerts in Slack or another channel, you’ll need to set up a Snowflake Alert object separately and route it to a notification integration.
2) Flexera One Data Cloud Optimization (formerly Chaos Genius)
Full disclosure: this is our own product. Flexera acquired Chaos Genius on January 6, 2026, and it now lives inside the Flexera One platform as Flexera One Data Cloud Optimization. We’re covering it here because it’s genuinely one of the most capable Snowflake observability tools available, and we think you should know what it does and why it matters.
Where Snowflake’s native tools give you the levers to control spending, Flexera gives you the intelligence layer on top, plus the autonomous agents to act on what that intelligence finds. The core distinction from tools like Resource Monitors: it doesn’t wait for you to hit a threshold. It continuously analyzes workloads, surfaces the root cause of inefficiency and, with autonomous agents enabled, takes corrective action without requiring any kind of manual intervention.
How the autonomous agents work
The agents continuously monitor warehouse sizing and workload patterns. When a warehouse is consistently oversized for its actual query load, an agent can right-size it automatically. When a query is repeatedly running inefficiently, the platform flags it with a specific tuning recommendation.
Key features:
- Granular cost visibility: Drill-down cost attribution across Snowflake services including Warehouse Compute, Snowpipe (PIPE), Search Optimization, Auto-Cluster, Data Storage and Data Transfer
- Warehouse performance monitoring: Tracks utilization, idle credits, query spillage to local and remote storage, and queue times per warehouse. Automated right-sizing recommendations are generated based on actual workload patterns, not static thresholds
- Query optimization: Analyzes workloads across hundreds of millions of queries, ranked by cost, run time, queue time and partitions scanned. Recommendations are query-specific, not generic
- Storage cost management: Identifies unused tables and redundant data, with recommendations to reduce storage footprint without breaking downstream dependencies
- Autonomous agents: Continuously tunes compute resources and scales warehouses based on live workload data, eliminating idle waste without manual intervention
- User and role-level visibility: Cost attribution by Snowflake role and user, useful for chargeback, showback and governance across teams
- Alerting: Email and Slack alerts for anomalous usage, cost spikes and threshold breaches
- Data access and governance: Role management and access control visibility alongside cost data
3) New Relic (Snowflake integration)
New Relic is an observability platform that lets users monitor, optimize and fix their apps and infrastructure. The platform is capable of monitoring applications/infrastructure as well as being good at managing logs and errors.
There are numerous accessible New Relic integrations available, including Snowflake.
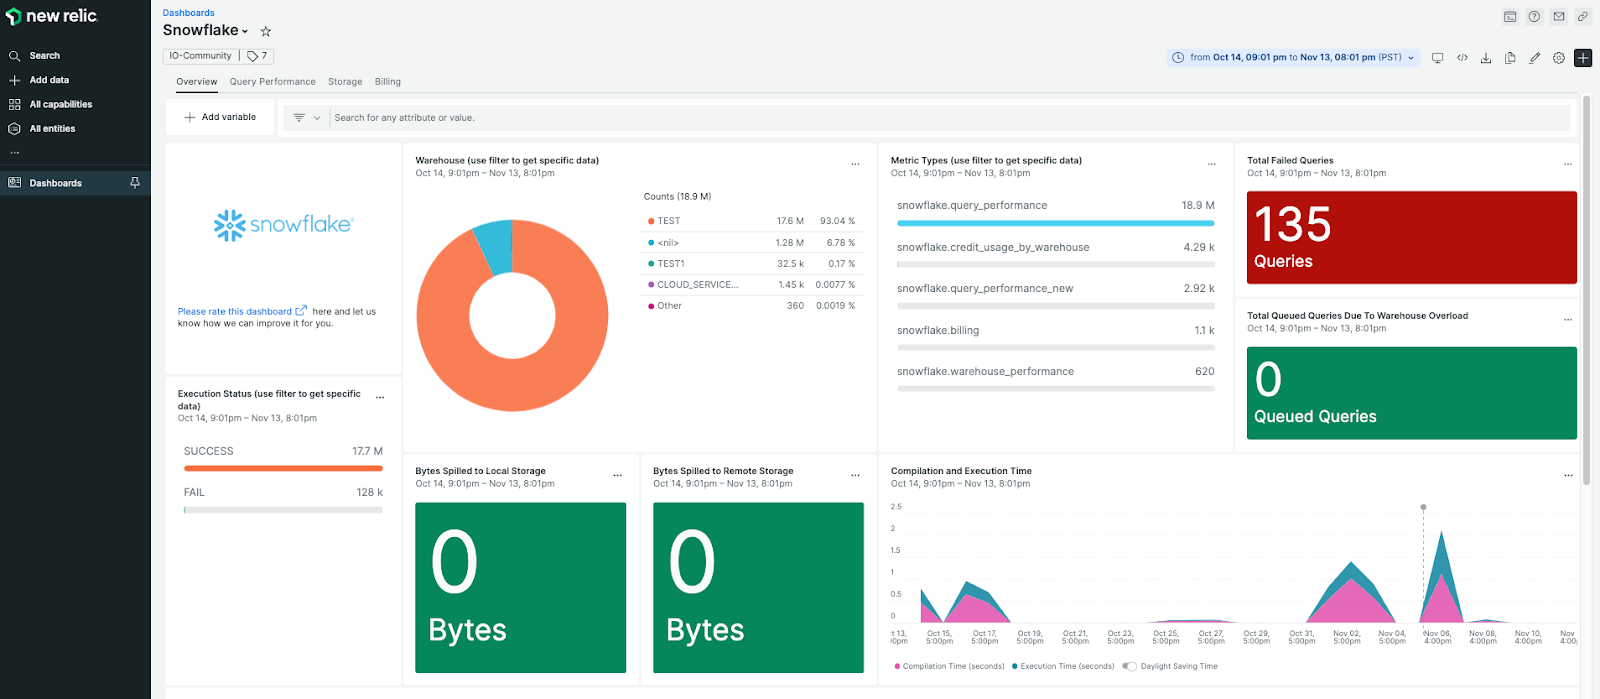
Its Snowflake integration extends that coverage to your data warehouse, giving you query performance metrics, warehouse utilization data, login and security monitoring and credit usage visualization inside the New Relic interface.
Key features of New Relic (Snowflake Integration):
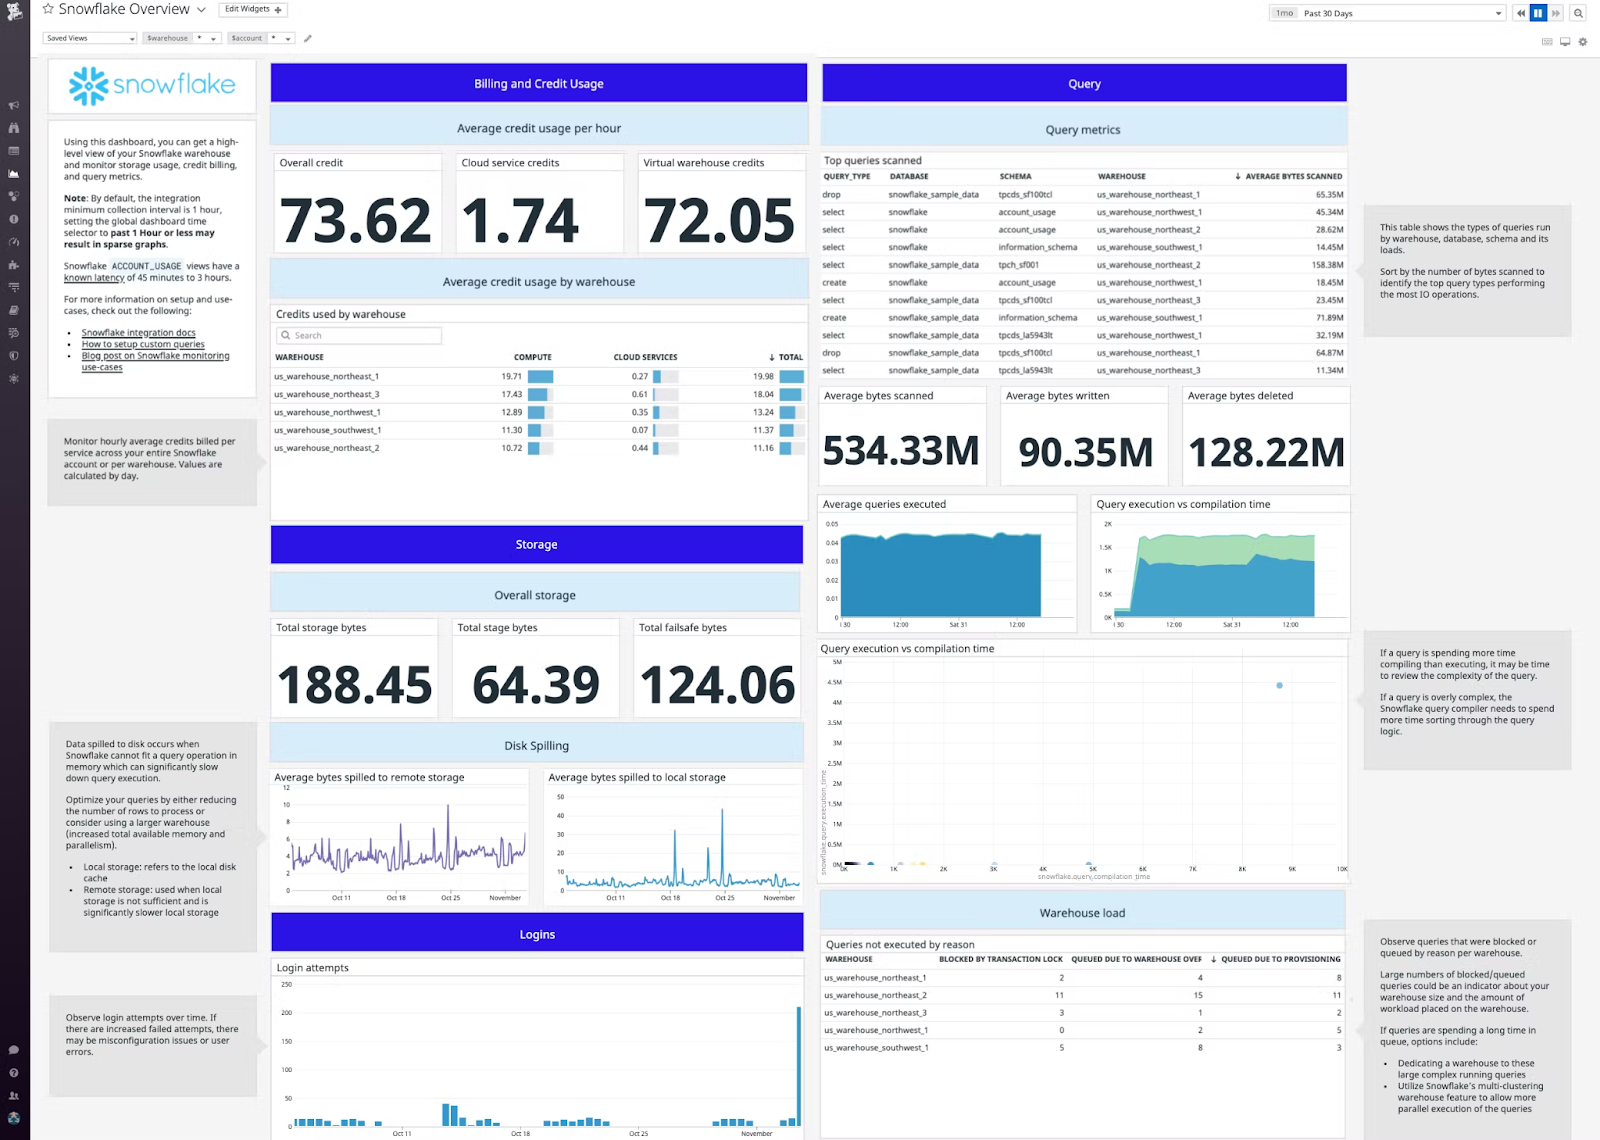
- Pre-built dashboard covering credit usage, query performance, longest-running queries and warehouse utilization
- Four built-in alert conditions: bytes spilled to local storage, bytes spilled to remote storage, failed queries and queued queries; each with configurable thresholds and Slack/PagerDuty integration
- Security monitoring: tracks login activity, failed authentication attempts and login methods (ODBC, UI, programmatic)
- Custom data ingestion: you can add SQL queries to the configuration file, and New Relic will run them on a schedule and store the results; useful for pulling in business metrics from Snowflake alongside operational data
- NRQL-based spend alerts: configure custom alerts on warehouse credit spend using New Relic Query Language, including linear spend forecasting to predict when a warehouse is on track to exceed a budget
You can find the integration on GitHub, which is worth noting. It’s maintained and functional, but it carries less guarantee of enterprise support than New Relic’s official integrations.
4) Datadog (Snowflake integration)
Datadog is a cloud-based monitoring and analytics platform used widely across engineering and operations teams. Its Snowflake integration provides warehouse performance monitoring, query analysis, cost tracking, security monitoring and Snowpark visibility inside the broader Datadog observability stack.
Unlike the New Relic integration, Datadog’s current Snowflake integration is API-based and doesn’t require an on-host agent for basic connectivity. Datadog’s documentation recommends creating a dedicated Datadog-specific Snowflake role and user with minimal required privileges, then connecting via Snowflake’s REST API.
Key features Datadog (Snowflake Integration):
- Warehouse performance monitoring: query throughput, queued queries, credit consumption and warehouse utilization metrics out of the box
- Long-running query detection: surface expensive queries and the users running them, which directly supports cost attribution
- Cost monitoring and Cloud Cost Management (CCM): Datadog’s CCM Snowflake integration (available in preview at time of writing) breaks down Snowflake spend by service and allows filtering alongside other cloud infrastructure costs
- Anomaly detection: compares current Snowflake storage and compute usage against historical baselines to flag unusual patterns
- Misconfiguration and security alerts: monitors for permission changes, failed logins and unusual access patterns
- Snowpark monitoring: ingests Event Table logs from Snowflake Trail, giving visibility into Snowpark stored procedures and functions alongside warehouse metrics
- 1,000+ integrations: correlate Snowflake performance data with upstream and downstream systems, from Apache Airflow to cloud provider metrics
Datadog makes sense for teams that already run it as their primary observability stack. The Snowflake integration slots in naturally alongside existing infrastructure monitoring. For teams using Datadog solely for Snowflake, the platform’s breadth may be more than needed and the cost structure reflects that.
5) BI dashboards: Snowflake usage templates
Snowflake provides comprehensive account usage data (in the SNOWFLAKE shared database and the ACCOUNT_USAGE schema) that can be visualized using Business Intelligence (BI) tools. While these do not offer observability, these are good first steps to get on top of your Snowflake usage and performance. Some of these dashboards are mentioned below:
- Looker: Snowflake Cost & Usage Dashboard
- Snowflake Account Usage in Tableau
- Snowflake Performance and Consumption SpotApp
Note: These dashboards are primarily for visualization. Unlike the dedicated tools above, they generally do not offer automated “right-sizing” recommendations or real-time active alerting for query termination.
That said, it’s worth being direct about their limits. These are visualization layers, not observability platforms. They don’t provide real-time alerting, automated recommendations, anomaly detection or warehouse right-sizing suggestions. They also have a meaningful query lag: ACCOUNT_USAGE views have a 45-minute to 3-hour latency depending on the view, so they’re not suitable for catching runaway queries in the moment.
Use BI dashboards as your entry point. Graduate to dedicated tooling when your team is large enough that attribution, anomaly detection and automated recommendations start saving material time and money.
How to choose
The right tool depends on where you are in your Snowflake maturity:
- Just getting started or running a small team: Use Snowflake’s native Resource Monitors and Budgets together. They cover the fundamentals at no additional cost
- Growing team with multiple warehouses: Flexera One Data Cloud Optimization delivers automated recommendations, anomaly detection and autonomous right-sizing for teams that need more than native Snowflake tooling provides; particularly if cost attribution across multiple warehouses and teams is a priority
- Teams already on New Relic or Datadog: Extend your existing stack with the respective Snowflake integration rather than adopting a separate tool. The operational overhead of managing another platform rarely makes sense when a capable integration already exists
- Teams that want maximum flexibility: BI dashboards give you full control over what you track and how it’s visualized, but you’ll need to invest in building and maintaining them
Save up to 30% on your Snowflake spend in a few minutes!
Conclusion
And that’s a wrap! Snowflake observability isn’t optional at scale. Unchecked warehouse sizes, inefficient queries and serverless features running wild can turn a predictable Snowflake bill into an unpleasant monthly surprise.
Start with what Snowflake gives you natively: Resource Monitors for warehouse suspension and Budgets for serverless coverage. Pair them with BI dashboards if your team already lives in Looker, Tableau or Snowsight. When those tools stop being enough, Flexera, Datadog and New Relic each offer deeper automation, richer anomaly detection and tighter integration with the rest of your stack.
The main thing is to start. The longer your Snowflake environment runs without observability coverage, the harder it becomes to separate signal from noise when something goes wrong.
FAQs
What is the difference between Snowflake Resource Monitors and Snowflake Budgets?
Resource Monitors actively control virtual warehouse compute by suspending warehouses when credit limits are reached. They do not cover serverless features. Budgets monitor credit usage across both warehouses and serverless features (like Snowpipe and automatic clustering), operate on a calendar-month cycle and send notifications when spending is projected to exceed a set limit. For complete cost coverage, use both.
Can Snowflake observability tools help with troubleshooting data loading issues?
Yes. Tools like Flexera and Datadog can surface failed query patterns, ingestion performance metrics and pipeline latency data. For Snowpipe-specific issues, Snowflake’s ACCOUNT_USAGE.COPY_HISTORY and PIPE_USAGE_HISTORY views give detailed load history. New Relic can also monitor failed queries and alert on threshold breaches tied to data loading workloads.
Can Snowflake observability tools optimize resource utilization?
Yes, but with varying depth. Resource Monitors can stop runaway warehouses but don’t recommend right-sizing. Flexera provides automated recommendations for warehouse sizing based on actual workload patterns. Datadog provides utilization visibility and cost attribution, but optimization recommendations are more manual. The depth of automated optimization varies significantly between tools.
Do Snowflake Resource Monitors cover serverless features like Snowpipe or automatic clustering?
No. Resource Monitors only apply to user-managed virtual warehouses. Snowflake Budgets is the correct tool for monitoring serverless feature credit consumption. This distinction is important because serverless costs can grow independently of warehouse activity, and a Resource Monitor won’t stop a runaway Snowpipe job.
Does New Relic’s Snowflake integration require an on-host agent?
Yes. The integration uses nri-flex, which requires the New Relic infrastructure agent to be installed on a host with access to your Snowflake account. It’s not a direct cloud-to-cloud SaaS connection. Teams that don’t already run the New Relic infrastructure agent will need to factor in that setup when evaluating the integration.
How often does ACCOUNT_USAGE data update in Snowflake?
Most ACCOUNT_USAGE views have a data latency of 45 minutes to 3 hours. Some views, like LOGIN_HISTORY, refresh within roughly 2 hours. This latency makes ACCOUNT_USAGE-based BI dashboards unsuitable for real-time alerting or catching active warehouse runaway events. Use them for trend analysis and historical reporting.
Can I use Datadog for Snowflake without using it for other infrastructure monitoring?
Technically yes, but it’s probably not the most cost-effective approach. Datadog’s pricing is based on the volume of data ingested, hosts monitored and features enabled. If your only goal is Snowflake observability, a purpose-built tool like Flexera or Snowflake’s native tooling will likely cost less and require less configuration overhead.