Running Kubernetes at scale is powerful, but it’s also famously complex. Between fluctuating workloads, unpredictable cloud costs and the pressure to maintain performance, platform engineering and FinOps teams often struggle to balance efficiency, visibility and operational overhead.
While observability tools like Prometheus, Grafana and Datadog provide critical visibility into Kubernetes environments, visibility alone isn’t enough. Organizations also need intelligent automation and real-time optimization insights to reduce cloud spend and improve scaling decisions.
Ocean by Flexera helps solve this challenge by automating Kubernetes infrastructure optimization while integrating seamlessly into existing observability workflows.
Why observability matters more than ever
Kubernetes environments generate a massive amount of operational data: CPU/GPU and memory usage, pod lifecycle events, node health, autoscaling triggers and more. Without a strong observability stack, this data becomes noise instead of insight.
Many organizations already rely on at least one of the major observability pillars:
- Prometheus for metrics scraping
- Grafana for visualization
- Datadog for unified enterprise monitoring
Ocean doesn’t replace these tools—it enhances them. By exposing rich optimization and scaling metrics, Ocean plugs directly into existing observability pipelines, giving teams the transparency they need to trust and validate automation. As a pre-requisite to achieve the above, Ocean Metric Exporter should be enabled when installing the controller.
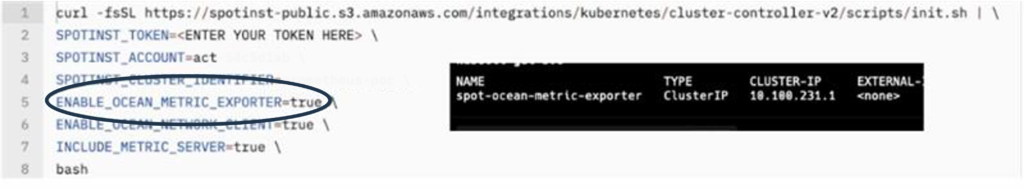
Enabling Ocean Metrics Exporter when installing Ocean Controller
Flexera’s Ocean + Prometheus: metrics you can trust
Ocean exposes a comprehensive set of metrics that Prometheus can scrape natively. These include:
- Node lifecycle events
- Autoscaling decisions
- Resource utilization
- Workload placement efficiency
- Cost‑related optimization data
Because these metrics follow standard Prometheus conventions, teams can integrate Ocean into their existing monitoring workflows without adopting new tools or dashboards.
By default, Ocean Metrics Exporter exposes scaling data only. To add cost and rightsizing metrics, values should be set by updated to include this information:
helm upgrade spot-ocean-metric-exporter spot/ocean-metric-exporter --reuse-
values --set "metricsConfiguration.categories={scaling,cost_analysis,rightsizing}" -n
spot-system
This provides accessible metrics in the format teams already use.
Flexera’s Ocean + Grafana: visualizing optimization in real time
Prometheus provides the data—Grafana brings it to life. Ocean’s metrics can be visualized in Grafana to show:
- Efficiency improvements
- Cost savings over time
- Node provisioning patterns
- Pod distribution and bin‑packing
- Scaling behavior during peak load
- Historical performance trends
This gives engineering, DevOps, SRE and FinOps teams the ability to validate Ocean’s decisions, not just trust them blindly.
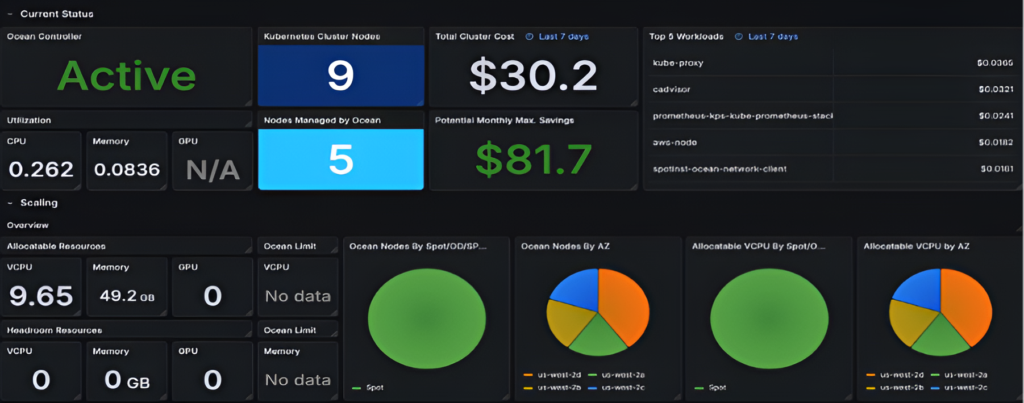
Grafana dashboard exposing Ocean metrics
Flexera’s Ocean + Datadog: Enterprise observability through simple annotations
For organizations standardizing on Datadog, Ocean integrates seamlessly through metrics exporter annotations. This lightweight approach allows Datadog to ingest Ocean’s optimization and autoscaling metrics without additional agents or custom pipelines.
With Datadog, teams can:
- Correlate Ocean events with application‑level telemetry
- Visualize optimization trends in existing dashboards
- Monitor events based on Ocean’s scaling or node lifecycle behavior
- Maintain a single observability plane across infrastructure and workloads
This is especially valuable for enterprises that rely on Datadog for logs, traces, APM and security monitoring. Ocean fits naturally into that ecosystem.
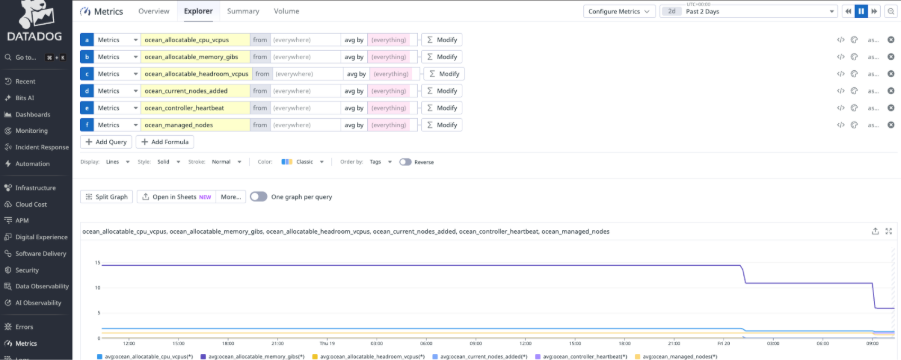
Datadog dashboard exposing Ocean metrics
To allow Datadog to access and display Metrics exporter metrics, the following annotations need to be added to Metrics Exporter Deployment:
spec:
.....
template:
 metadata:
  annotations:
   kubectl.kubernetes.io/restartedAt: "2026-02-16T11:05:53Z"
   prometheus.io/port: "5050"
   prometheus.io/scrape: "true"
The “/metrics” endpoint is already set by default so no need to add it to the annotations above.
In addition, DataDog agent installation should include the following two parameters to allow the agent to scrape metrics exposed by Metrics Exporter:
spec:
...
 features:
  prometheusScrape:
   enabled: true
   enableServiceEndpoints: true
How Kubernetes observability improves cloud cost optimization
Ocean already reduces cloud spend by optimizing node selection, bin‑packing workloads, rightsizing and leveraging Spot instances. But observability amplifies these savings by enabling teams to:
- Identify underutilized workloads
- Validate that automation is producing measurable cost reductions
- Detect misconfigurations that lead to unnecessary scaling
- Track cost trends in real time
- Provide transparent, auditable data for FinOps teams
In short, observability turns optimization into measurable ROI.
Teams that combine Ocean with Prometheus, Grafana or Datadog consistently report:
- Faster optimization cycles
- Better Spot utilization
- Fewer over‑provisioned nodes
- Clearer cost accountability
Automation saves money. Observability proves it.
Closing thoughts on these tools
![]()
Ocean by Flexera is already known for simplifying Kubernetes operations and reducing cloud costs through intelligent automation. But its real power emerges when paired with the observability tools teams already trust.
By integrating seamlessly with Prometheus, Grafana and Datadog, Ocean provides the transparency needed to understand, validate and maximize the impact of its optimization engine.
If you’re running Kubernetes in production, this combination isn’t just helpful—it’s transformative.
FAQ
How does Flexera’s Ocean reduce Kubernetes cloud spend?
Ocean continuously analyzes container usage and automatically scales infrastructure, using the most cost-efficient mix of spot, reserved, and on-demand instances. It also eliminates under-utilized capacity by scaling down unused resources and optimizing workload placement.
What is Kubernetes cost optimization?
Kubernetes cost optimization is the practice of reducing cloud spend by aligning infrastructure and resource usage with actual workload needs, avoiding over-provisioning and idle capacity.
How does Ocean by Flexera integrate with Prometheus, Grafana and Datadog?
Ocean by Flexera integrates with Prometheus, Grafana, and Datadog through its built‑in Ocean Metrics Exporter. The exporter exposes Ocean’s autoscaling, node lifecycle, optimization, and cost‑related metrics in standard Prometheus format, allowing existing observability tools to scrape and visualize Ocean data without adding new agents or replacing current monitoring workflows.
What Kubernetes metrics does Ocean expose for observability and optimization?
Ocean exposes a rich set of Kubernetes metrics, including autoscaling decisions, node provisioning and termination events, workload placement efficiency, resource utilization, and cost optimization data. These metrics give platform, DevOps, SRE, and FinOps teams visibility into why scaling decisions are made and how they impact performance and cloud spend.
Does Ocean work with Datadog for enterprise Kubernetes monitoring?
Ocean works seamlessly with Datadog using lightweight metrics exporter annotations. This allows Datadog to ingest Ocean’s autoscaling and optimization metrics into existing dashboards, alerts, and monitoring workflows—without additional agents or custom pipelines—so teams can maintain a single observability plane across infrastructure and applications.