
Businesses today sit on more data than ever, and making sense of it demands tools built for scale. Cloud data warehouses like Snowflake handle this well: they offer fast, scalable query processing across massive datasets. But Snowflake query optimization isn’t something you can skip just because the platform is powerful. Without it, queries slow down, warehouse sizes balloon, and compute bills grow faster than your data does.
We’ve split this guide into two parts. Part 1 covers the built-in Snowflake features you can use to improve query performance. Part 2 goes into some common mistakes to avoid while writing Snowflake queries, which can quietly kill performance in the first place.
7 best practices for Snowflake query optimization
1) Choose the right virtual warehouse size
Getting warehouse sizing right is one of the highest-leverage things you can do for both performance and cost. Too small, and your queries spill data to disk and crawl. Too large, and you’re paying for compute that sits idle.
Start small. Begin with the X-Small warehouse size and benchmark your actual workload. Two signals tell you when a warehouse is undersized.
First, check for local and remote disk spillage in the Query Profile. Spillage means Snowflake ran out of memory and started writing intermediate query results to disk, which slows things down considerably.
Second, watch the Warehouse Load monitor in Snowsight. Consistent query queuing is a clear sign you need more parallelism.
When you see queuing, the right fix isn’t always to jump to a larger warehouse size. Upgrading from Small to Medium doubles your compute cost but only doubles throughput for parallel workloads. If the problem is concurrency rather than query complexity, convert the warehouse to a multi-cluster warehouse with a maximum cluster count of 2 or 4. That addresses queuing without throwing extra resources at single-query execution.
Reserve larger warehouse sizes (Large and above) for genuinely complex analytical workloads: queries with large sort operations, heavy window functions, or joins on very large tables.
2) Using Snowflake’s caching layer
Caching is where Snowflake quietly does some of its best work. The platform runs three distinct cache layers, each operating at a different level of the architecture. Knowing all three helps you write queries and configure warehouses in ways that get full value from them.
a) Result Cache
The result cache lives in the Cloud Services layer and stores the complete output of every query for 24 hours. If an identical query runs again within that window and the underlying data hasn’t changed, Snowflake returns the result instantly without spinning up a warehouse. That means zero compute cost. The result cache is shared across all virtual warehouses in the account, so one user’s query can save compute for anyone else running the same query later.
The catch: the query text must match exactly, the underlying data must be unchanged and the same role must be in use. Even a whitespace difference in the SQL bypasses the result cache.
b) Warehouse cache (local disk cache)
The warehouse cache, also called the local disk cache, lives in the Compute layer on the SSD of each active warehouse node. When a query pulls micro-partitions from cloud object storage (Amazon S3, Azure Blob Storage or Google Cloud Storage), Snowflake caches those micro-partitions locally on the warehouse’s SSDs. A subsequent query that touches the same data reads from local SSD instead of going back to remote storage, which is significantly faster.
This cache is local to each warehouse and is cleared whenever the warehouse suspends. That’s why auto-suspend settings have a real impact on query performance.
c) Metadata cache
The metadata cache also lives in the Cloud Services layer and stores table statistics: row counts, minimum and maximum column values, distinct value counts and micro-partition file locations. Snowflake uses this metadata to perform partition pruning before any data is scanned. For simple aggregate queries like COUNT(*), Snowflake often answers directly from metadata without touching a warehouse at all.
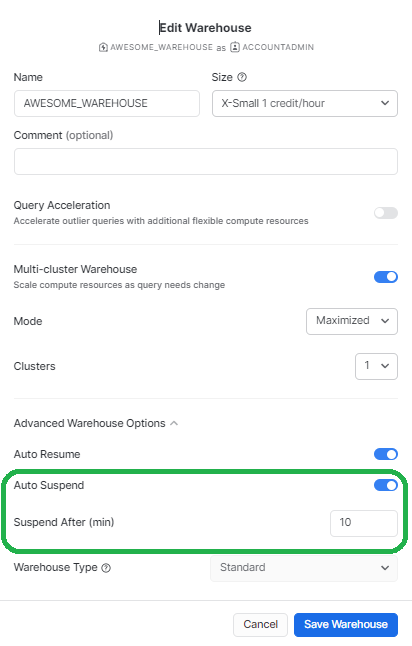
Getting auto-suspend right
The auto-suspend setting directly affects your warehouse cache. Set it too aggressively (say, 60 seconds) and the cache clears constantly, forcing Snowflake to re-fetch data from remote storage on every restart. Set it too loosely and you pay for idle compute.
For instance, if you set the auto-suspend setting to suspend after 1 minute, the warehouse may restart with the clean cache, leading to a delay in the execution of the initial queries until the relevant data is cached again. On the other hand, setting the auto-suspend feature to suspend never or large intervals like 10 mins can keep the cache warm for longer durations, but it will incur costs for compute resources even when no queries are being executed. To solve this, it is best to start with the auto-suspend set to the minimum possible limit of 60 seconds and then experiment with higher auto-suspend once one starts observing slowing query performance.
3) Using Materialized Views
Materialized views in Snowflake is a precomputed query result stored as a physical object in Snowflake. Unlike a standard view, which re-executes its underlying query every time it’s referenced, a materialized view stores the result and updates it incrementally as the base table changes. Because the result is already computed, queries against a materialized view run faster than running the same query against the base table directly.
Snowflake Materialized views are worth using in these situations:
- The query involves expensive aggregations or computations that run frequently, but the source data changes infrequently
- The query targets an external table backed by files in cloud storage (Parquet, ORC, JSON, CSV), where every scan hits remote object storage directly
- The query is used repeatedly by multiple users or BI tools and the underlying data is relatively stable
There is one limitation: a Snowflake materialized view can only reference a single base table. Joins are not supported. If your use case requires joining multiple tables, a materialized view won’t work. Consider a dynamic table or a scheduled task that writes results to a regular table instead.
Materialized views also consume storage and carry a compute cost for background refresh. Before creating one, check that the performance gain justifies those costs.
4) Understand micro-partitioning and use clustering keys
Every table in Snowflake is automatically divided into micro-partitions when data is loaded. Each micro-partition holds between 50 MB and 500 MB of uncompressed data and stores that data in columnar format. Snowflake also tracks metadata per micro-partition: the minimum and maximum values per column, the row count and the distinct value count.
This metadata is what makes partition pruning possible. When you filter a query on a column, Snowflake checks micro-partition metadata first and skips any partitions that can’t contain matching rows; no data gets scanned in skipped partitions.
The problem is that micro-partitioning follows the natural insertion order of the data. If rows are inserted randomly relative to the column you most often filter on, pruning becomes ineffective: matching rows end up scattered across many micro-partitions and Snowflake has to scan most of them anyway.
That’s where clustering keys come in. A clustering key tells Snowflake to organize data so that rows with similar values in the specified columns land in the same micro-partitions. This tightens pruning dramatically for filtered queries on large tables.
When picking a clustering key, choose the column(s) that appear most often in WHERE clauses. Date or timestamp columns work well for time-series data. High-cardinality columns with few repeated values make poor candidates because they offer little co-location benefit.
Clustering has a cost. Snowflake runs a background reclustering process to maintain the organization as new data arrives. For tables that don’t change often, the one-time clustering cost is all you pay. For frequently updated tables, automatic clustering carries an ongoing credit charge. Evaluate the query performance improvement against that cost before enabling it.
5) Use Snowflake Query Acceleration Service
Snowflake Query Acceleration Service is a serverless feature available in Snowflake’s Enterprise edition and higher. It offloads portions of query processing to shared compute resources outside your warehouse, which speeds up queries that scan large data volumes or apply complex filters.
Let’s say that when you run a query in Snowflake, it first checks to see if it has enough resources to run the query. If the cluster is already too busy, the query gets queued and put on hold, which can be a big problem when running massive workloads that include both short queries and long queries. Long-running queries also stop other queries from running. Most of the time, moving to a bigger warehouse is the only viable option. But if you run big queries on an X-LARGE cluster, execution times will be faster for sure. But as we’ve already talked about, this isn’t the best solution because short queries don’t use all of the resources, which can lead to huge overall query costs.
QAS handles this differently. When Snowflake detects a query eligible for acceleration, it offloads the heavyweight parts of that query, mainly large table scans and filter operations, to shared serverless compute. The warehouse itself stays sized for normal workloads, short queries keep running without waiting, and the heavy query finishes faster. You only pay for QAS resources when they’re actually in use, billed per second, separately from your warehouse credits.
Enabling QAS
For new multi-cluster and Gen2 warehouses created from 2025 onward, Snowflake enables QAS by default. If you’re on an existing standard warehouse, enable it manually:
ALTER WAREHOUSE <warehouse_name> SET ENABLE_QUERY_ACCELERATION = TRUE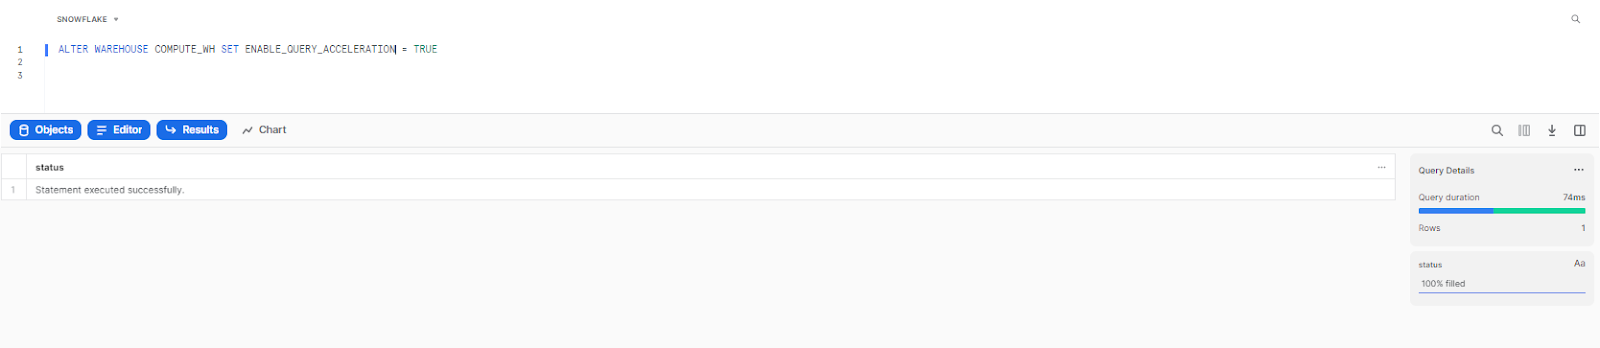
You can also set a scale factor to cap how many additional QAS resources a warehouse can consume:
ALTER WAREHOUSE <warehouse_name> SET QUERY_ACCELERATION_MAX_SCALE_FACTOR = 8;
A scale factor of 0 means unlimited. Any other value caps the resource multiplier relative to your warehouse size. Monitor actual QAS usage in QUERY_ACCELERATION_HISTORY to tune this and avoid unexpected cost spikes.
6) Use the Snowflake Query profile tool
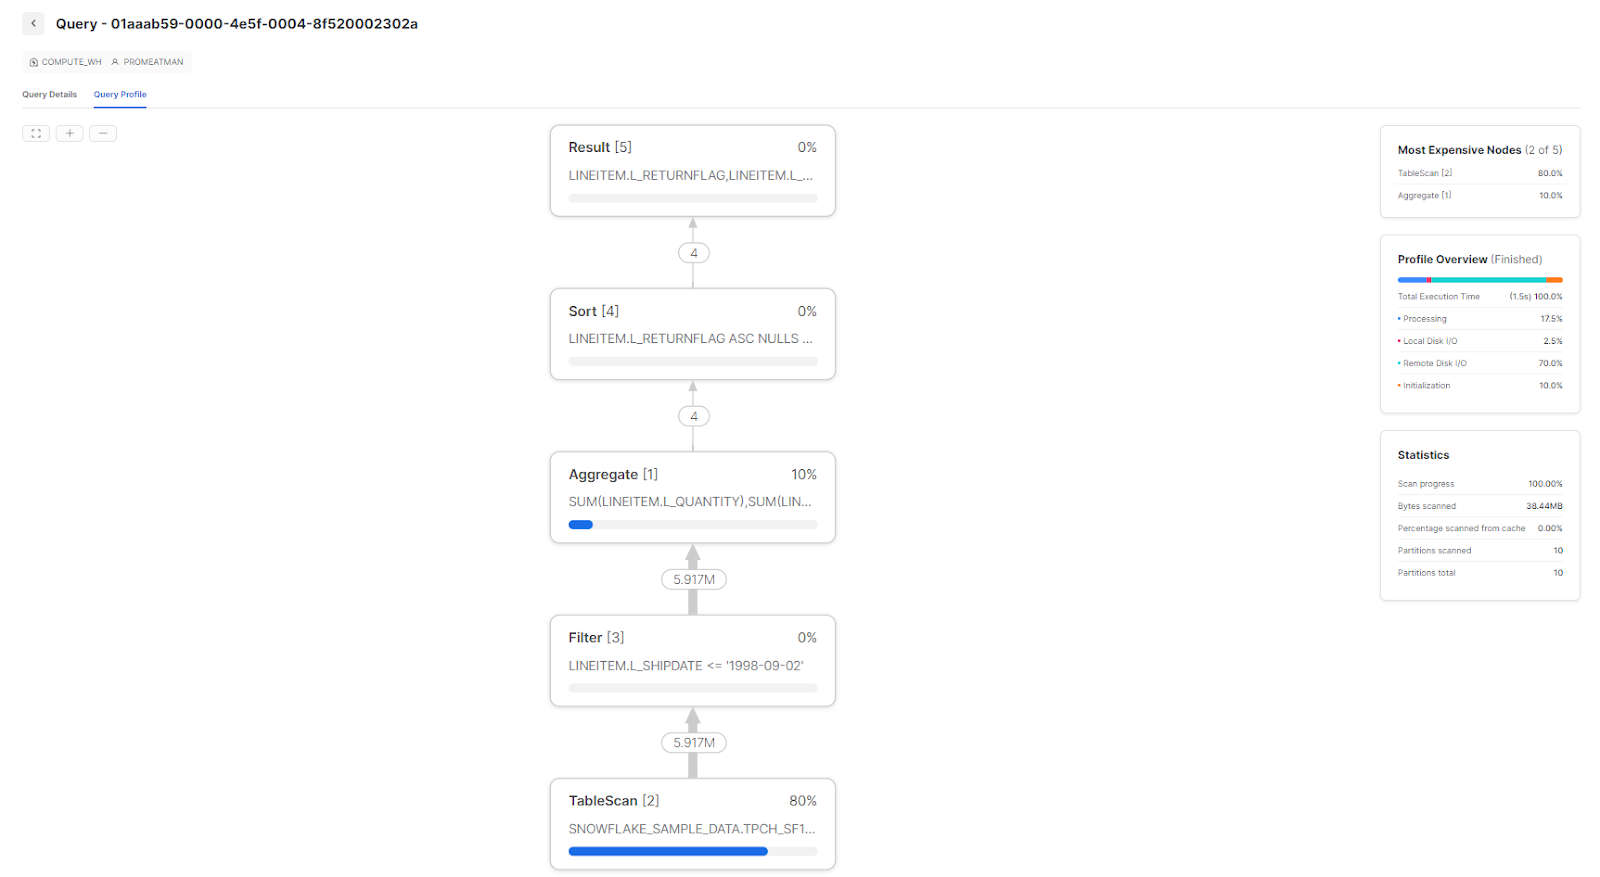
Snowflake Query Profile is Snowflake’s built-in execution analyzer. After every query runs, Snowflake generates a visual breakdown of every operation in the query plan, with timing, row counts and resource consumption metrics for each step.
Access it from Snowsight: go to query history, click any query, and open the Profile tab. The profile displays a tree of operator nodes, each representing a step in query execution. Nodes that consumed the most time appear prominently.
Using the Snowflake Query Profile tool can help identify several common issues with Snowflake query performance, which include:
Make the Query Profile a habit for any query that takes longer than expected. It usually points directly at the root cause.
Check out this article to learn everything you need to know about Snowflake query profile
7) Use the Snowflake Search Optimization Service
/blog/finops/snowflake-search-optimization-part1/
At last, we have a Snowflake Search optimization service, which is considered one of the best ways to optimize Snowflake query performance.
Search Optimization Service targets a specific problem: point lookup queries on large tables. These are queries that filter on a high-cardinality column and return a small number of rows.
Standard micro-partition pruning is good, but it works best when data is clustered around the filter column. If the table isn’t clustered on the lookup column, Snowflake may still scan many partitions. SOS builds a persistent secondary data structure called a search access path that maps column values directly to the micro-partitions containing them. This lets Snowflake skip to the right partitions immediately.
SOS is available in Snowflake’s Enterprise edition and higher.
Enabling SOS
You can enable SOS at the table level using ALTER TABLE.
First, grant the required privilege on the schema (if it hasn’t been granted already):
GRANT ADD SEARCH OPTIMIZATION ON SCHEMA <schema_name> TO ROLE <role>Then enable it on the table:
ALTER TABLE <table_name> ADD SEARCH OPTIMIZATION;
To target specific columns and query types, which saves credits by avoiding search paths for columns you rarely look up:
ALTER TABLE <table_name> ADD SEARCH OPTIMIZATION ON EQUALITY(<column_name>);
Snowflake builds the search access path as a background process. For large tables, this can take minutes to hours and temporarily increases credit consumption. Before enabling SOS on a large table, estimate the build cost:
SELECT SYSTEM$ESTIMATE_SEARCH_OPTIMIZATION_COSTS('<table_name>');
SOS is a good fit when the table is at least a few hundred GB in size, the lookup column has 100,000 or more distinct values, the query is highly selective (returning a small number of rows) and the query typically runs for several seconds or more without SOS.
Save up to 30% on your Snowflake spend in a few minutes!
Conclusion
Snowflake query optimization is essential for maximizing performance and avoiding excessive Snowflake costs. Snowflake can handle enormous data volumes, but throwing more compute at a slow query is rarely the right answer. Right-sizing your warehouses, understanding how caching actually works, clustering your data thoughtfully and using features like QAS and SOS where they fit. These habits compound into faster queries and lower Snowflake bills over time.
This is the end of Part 1 of the article, where we covered various different Snowflake features that can help improve Snowflake query optimization. Here’s a summary of what we covered:
1) Right-sizing virtual warehouse resources and using multi-cluster warehouses for concurrency
2) Understanding all three cache layers (result cache, warehouse cache and metadata cache) and tuning auto-suspend accordingly
3) Using materialized views for stable, expensive queries on single tables or external data
4) Micro-partitioning, partition pruning and clustering keys for efficient data scanning
5) Query Acceleration Service for outlier heavy queries in mixed workloads
6) Query Profile for diagnosing execution bottlenecks and spillage
7) Search Optimization Service for high-cardinality point lookup queries
In the second part of the article, we will delve further into the topic by discussing common mistakes to avoid when writing Snowflake queries.
FAQs
Why does Snowflake performance tuning matter?
Performance tuning delivers faster query results and reduces costs by cutting unnecessary compute usage. Snowflake charges by the second for virtual warehouse compute, so poorly optimized queries that run longer or require larger warehouses directly increase your bill.
What is query optimization in Snowflake?
Query optimization in Snowflake is the process of improving query execution to reduce runtime, minimize resource usage and lower data warehouse costs. It includes techniques like warehouse right-sizing, caching, clustering, and using features like QAS and SOS.
How does Snowflake execute queries?
Snowflake distributes query workloads across multiple worker nodes inside a virtual warehouse, using massively parallel processing (MPP). The Cloud Services layer handles query parsing, optimization and plan generation before execution begins on the virtual warehouse.
What are the three cache layers in Snowflake?
Snowflake has a result cache (Cloud Services layer, 24-hour retention, zero compute cost), a warehouse cache also called the local disk cache (Compute layer, lives on warehouse SSD, cleared on suspend) and a metadata cache (Cloud Services layer, stores table statistics to power partition pruning).
What is Snowflake caching and how does it improve query performance?
Snowflake caching stores query results, raw micro-partition data and table metadata at different layers of the architecture. Caching reduces or eliminates the need for warehouse compute on repeated queries and minimizes remote storage access for frequently scanned data.
How does partition pruning work in Snowflake?
Snowflake maintains metadata for each micro-partition, including the minimum and maximum values for every column. When you run a filtered query, Snowflake reads this metadata first and skips any partitions that couldn’t contain matching rows. Clustering keys improve pruning by concentrating similar values into the same partitions.
What is the impact of warehouse size on query performance in Snowflake?
A larger warehouse size gives each query more memory and parallel processing nodes, which helps complex queries with large sorts, aggregations and joins. But size alone doesn’t speed up all queries. If the bottleneck is concurrency rather than query complexity, multi-cluster warehouses are the better answer.
Why is a Snowflake query slow?
Slow queries usually come from one of a few causes: disk spillage from an undersized warehouse, inefficient pruning because clustering doesn’t match the query filter, poorly written SQL (like missing join conditions that produce cartesian products) or lack of caching because the warehouse is suspending too frequently. The Query Profile is the fastest way to pinpoint which one applies.
When should I use the Search Optimization Service vs. a clustering key?
Use a clustering key when most of your queries filter on the same column(s) and you’re running range scans or aggregations across large data sets. Use SOS when you run point lookups — queries that return a single row or a small group of rows by exact match — and the table isn’t clustered on the lookup column. The two features aren’t mutually exclusive; they address different access patterns.
Does the Query Acceleration Service work for all query types?
No. QAS focuses on queries that involve large table scans, high data volume per query, or unpredictable data access patterns; things like ad hoc analytics or queries with complex filters on large tables. It doesn’t help queries that are slow because of poor SQL logic, excessive joins, or data spillage from an undersized warehouse. Use the Query Profile to confirm your query is a QAS candidate before enabling it.
How can I identify queries with poor performance in Snowflake?
Start with query history in Snowsight, sorted by execution time. Open the Query Profile for slow queries and check for spillage, high partition scan ratios and exploding joins. For account-wide visibility, query SNOWFLAKE.ACCOUNT_USAGE.QUERY_HISTORY and look at bytes_spilled_to_local_storage, bytes_spilled_to_remote_storage, partitions_scanned and partitions_total.