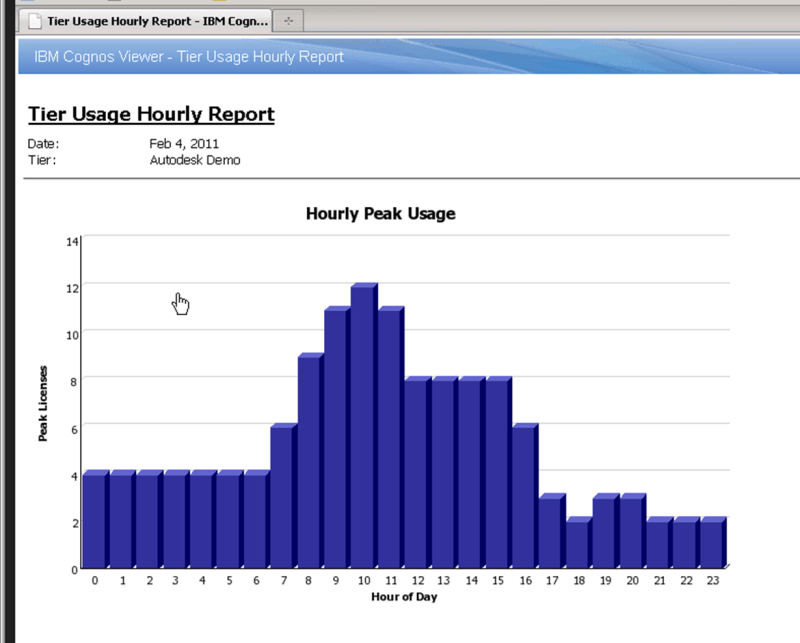
I’ve been asked recently, by quite a few enterprises, how they can optimize their concurrent licensing estate by analysing the usage data produced by these types of applications. In contrast to what we call Node-locked licensing (licensed locked to a specific machine), concurrent licenses float through the network and are passed from user to user and machine to machine. This makes them harder to track—as though you were trying to catch a moving bullet. My experience configuring and analysing concurrent licenses has helped me realize that there are at least four key factors to take into consideration when you want to optimize your landscape:
- Determine what usage means for each application
- Understand the way the application is licensed in the contract
- Design a cost model to apply software cost by application
- Design a reporting strategy
Knowing how to define “usage” of software is not always easy or well understood. Although we have reporting tools that can provide metrics such as peak usage, average usage, max hours spent or denials of service (license unavailable), these should not be the only elements we take into account. Firstly, we must understand that usage can be interpreted differently for different applications. Some applications are run in batch mode for several weeks, while others will run for a few seconds, then shut down, and another group of applications might require constant interaction via the user interface. This wide range of application use models reflects the reality of what is out there.
In addition, concurrently licensed applications often have individually licensed functionality called ‘features.’ The nature of application usage is then defined by how features are utilised in relationship to your contract as well as the type of application behaviour described earlier.
Once you are familiar with the usage model for the application, you need to start looking at how it is licensed. Read your contract and find the relationship between the usage of a feature or group of features, the corresponding product, and what you are paying for under the terms of your contract. Also, you need to understand the renewal frequency of the contract (yearly, quarterly, etc.). All of these elements define what we call the license model of an application. If the interrelation between these elements is blurry, do not hesitate to ask the software vendor for clarification, as they are the one defining them. Knowing the license model will allow you to focus your attention on only relevant feature usage.
Being familiar with your contract and application and how they relate to one another will allow you to design an appropriate software cost model. This will allow you to understand how applications are used and how much it costs you. The model will be based on the type of application, the feature to “contract product” relationship, and the usage pattern that you want to measure. For instance, for an application that is only used through a user interface, you could be looking at tracking metrics such as— peak licenses used per day, average denials per day, and average time spent in the application for an individual user.
As peak usage is a complex datapoint involving users, elapsed time spent on the application, and the date, you cannot simply compare that with scalar values such as number of denials or total time. Taking an average allows for better comparison as it will take out variation over time as well. You will need to get those values for features or groups of features that can be identified in your contract. You will need the proper software asset management tools to get accurate raw usage data as well as aggregated and calculated data for concurrently licensed applications.
Now that you have an understanding of the relevant usage type for the application and how it is licensed, it is time to create a reporting strategy. You will need to consider several items. For instance, do you need extra data sources rather than just the raw usage data? What is the collection frequency of the data to be presented? What is the granularity of the data presented— hourly, daily, monthly, quarterly, etc.? Do you need to look at them from different perspectives (hours/day, days/month, months/year …). How can you apply cost? How do you archive the data and how will you retrieve past data? This will need to be done per application or group of applications if they have a similar type of license model. Moreover, you will need to understand how to best present the data to make it comprehensible to a large audience.
IT Asset Management
It all starts with knowing what’s in your IT ecosystem. Flexera One discovers even the most elusive assets whether on-prem, SaaS, cloud, containers and more.
As you can see, understanding your concurrent license usage implies that you can determine, per application, what usage is. In addition to that, you will need to decipher how applications are licensed per the terms of the contract. Based upon that information, you can create a model that will help apply and manage software costs. The model will be based on software usage data. The last step will be to put this model to work and create a reporting strategy in order to visualise the data in that model.
Understanding usage for concurrently licensed software is not an easy, straightforward task. It involves having a 360 degree view that goes from understanding the license model, all the way down to understanding the usage data for individual features. Having the proper tools and the correct methodology will allow you to understand how your concurrent (aka network) licenses are being used and help you to be better equipped for the next license renewal.
To learn more about SAM tools for managing and optimizing concurrent licenses, please visit our website.


