Snowflake’s architecture is impressively scalable, but scalability doesn’t automatically mean speed. If your queries are dragging or your costs keep climbing, Snowflake performance tuning is where you need to focus. We’ve covered various query optimization strategies in our previous articles (Part 1 and Part 2).
In this article, we will build upon those foundations and discuss additional methods to maximize the speed and effectiveness of your Snowflake workloads. So whether you are just getting started with Snowflake or have been using it for years, tuning your queries for peak efficiency is an essential skill. Follow along for an in-depth look at how to monitor, diagnose and remediate lackluster Snowflake performance. Let’s get started!
Why are your Snowflake queries running slow?
Before jumping into fixes, let’s address two misconceptions that consistently send teams down the wrong path.
Physical hardware resources don’t directly control query speed. Snowflake runs on cloud infrastructure and dynamically provisions compute. The amount of hardware you’ve provisioned doesn’t set a ceiling on individual query execution time the way it would in an on-premises setup.
Network latency is rarely the root cause. Snowflake executes query fragments in parallel across many nodes. The distributed nature of that execution means inter-node latency has far less impact than it would in a traditional warehouse. Yes, network issues can contribute, but they’re almost never the primary culprit behind consistently slow queries.
So what actually causes slow queries? Most of the time it comes down to a few concrete problems: queries sitting in a queue, poor cache utilization, row explosion from inefficient joins, insufficient partition pruning, or disk spillage. Those are exactly what we’ll cover.
Top 5 techniques for Snowflake performance tuning
1) Eliminate queuing (concurrency management)
Queuing is one of the most common, and most overlooked, causes of slow query times. It happens when a warehouse is already fully loaded and incoming queries have to wait for resources to free up. This occurs when the warehouse is overloaded, running queries consume all available compute slots, or all cores in the warehouse are occupied.
You can check for queuing by querying your session’s query history:
SELECT * FROM TABLE(INFORMATION_SCHEMA.QUERY_HISTORY_BY_SESSION(RESULT_LIMIT => 5))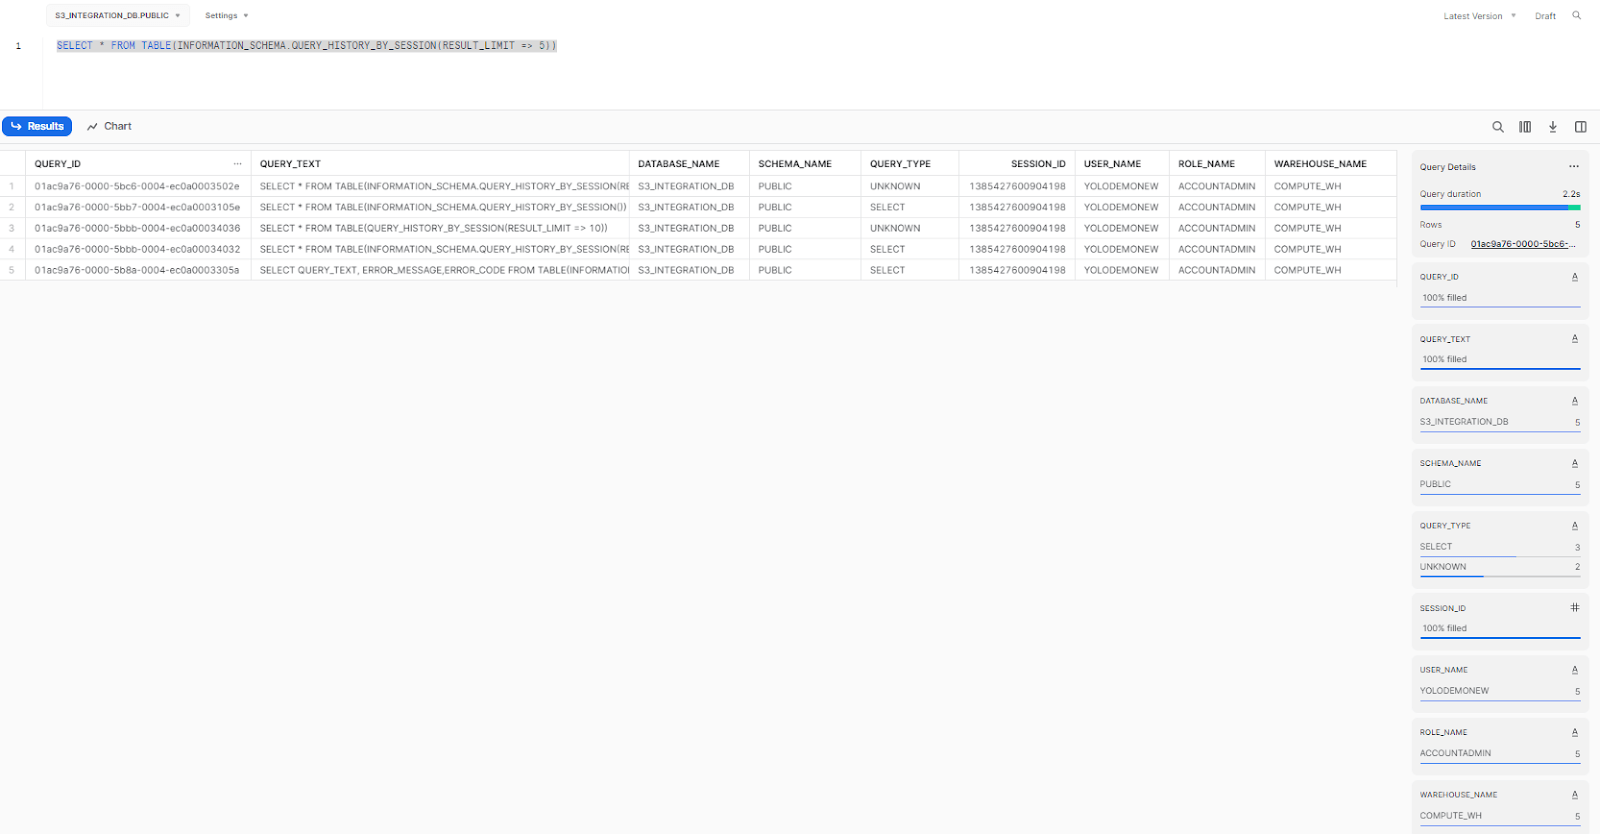
As you can see, it returns a table with information about all of the queries that have been executed in the current session.
Note: If you want to limit the number of results displayed in the console, you can use the RESULT_LIMIT parameter. However, there are other parameters that you can use to refine your result further; for example, END_TIME_RANGE_START(It specifies the start time of the time range to search for) and END_TIME_RANGE_END(It specifies the end time of the time range to search for).
How to reduce queuing?
The STATEMENT_QUEUED_TIMEOUT_IN_SECONDS parameter controls how long a query can sit in the queue before Snowflake cancels it automatically. It can be set at the session, warehouse, user, or account level. The default value is 0, which means no timeout is enforced and queries can wait indefinitely. Be deliberate about where you set this; conflicting values at different levels can create confusing behavior. When multiple levels are configured, Snowflake honors the lowest non-zero value.
To set it at the warehouse level:
ALTER WAREHOUSE <Warehouse_Name> SET STATEMENT_QUEUED_TIMEOUT_IN_SECONDS=60;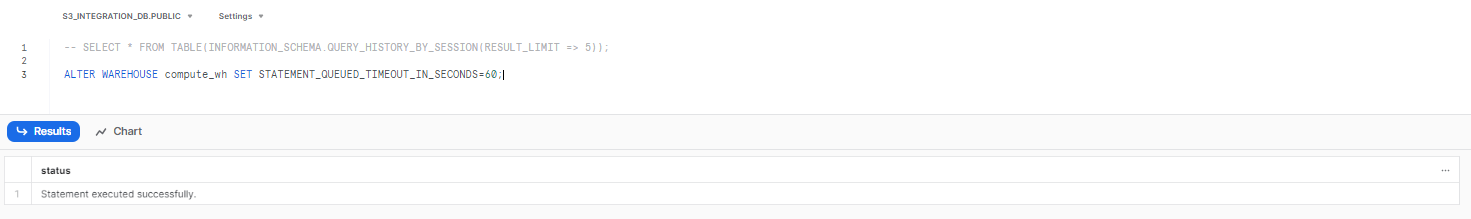
To set this parameter for a session, use the following command:
ALTER SESSION SET STATEMENT_QUEUED_TIMEOUT_IN_SECONDS=30;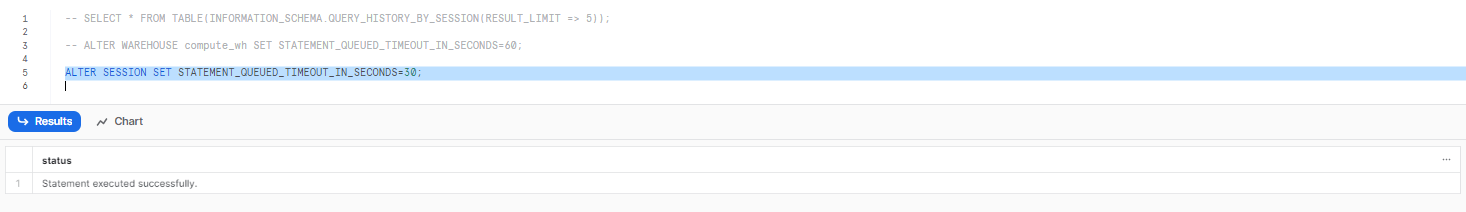
You can also tune the MAX_CONCURRENCY_LEVEL parameter, which controls how many queries can run concurrently in a warehouse cluster. The default is 8, with a maximum of 32. Think of it as a soft limit: Snowflake uses it to determine when queries should start queuing or, in multi-cluster warehouses, when it’s time to spin up an additional cluster.
Here’s an important nuance. In a single-cluster warehouse, queries queue up once the concurrency limit is hit. No new resources appear until running queries finish. In a multi-cluster warehouse, Snowflake can start an additional cluster when the existing one fills up, distributing the load across clusters. A new cluster serves multiple queued queries, not just one.
Lowering MAX_CONCURRENCY_LEVEL gives each running query access to more compute resources, which can significantly speed up large, complex queries. Raising it allows more queries to run in parallel but spreads resources thinner. Neither setting is universally better. Monitor CPU usage, memory, and your ratio of running to queued queries to find the right balance.
To set MAX_CONCURRENCY_LEVEL at the warehouse level:
Alter Warehouse <Warehouse_Name> Set MAX_CONCURRENCY_LEVEL=5;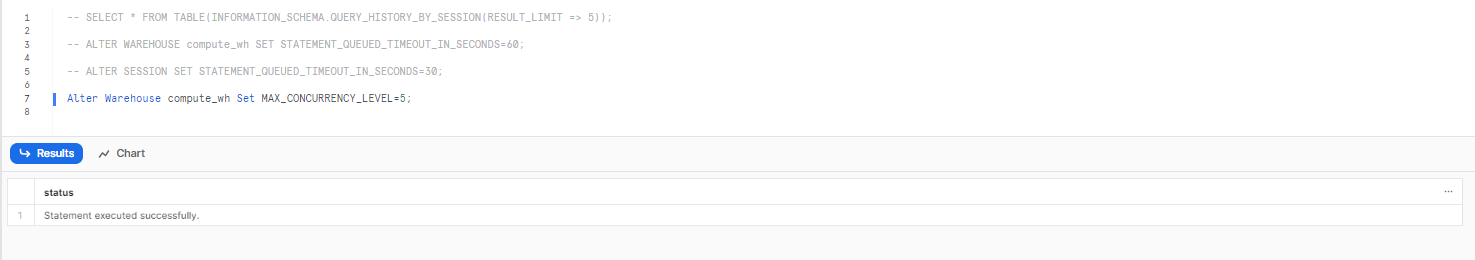
To set it at the account level, use:
Alter Account Set MAX_CONCURRENCY_LEVEL=8;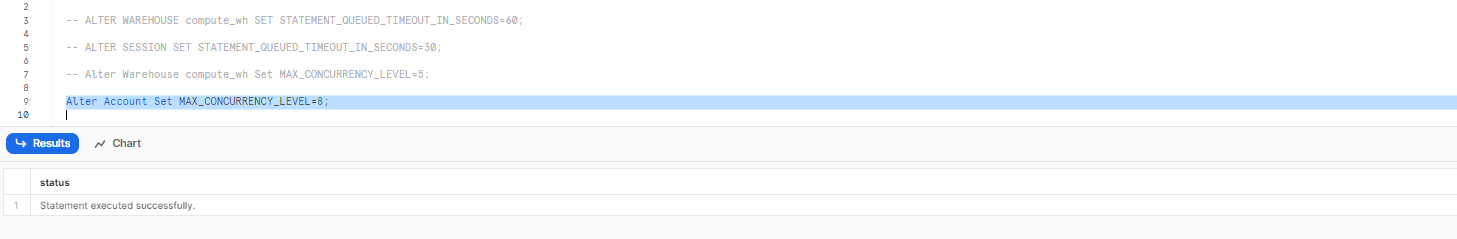
Note:
- Decreasing the concurrency level allocates more resources per query which improves performance.
- Increasing the level allows more queries to run concurrently but can reduce performance if the system gets overloaded.
- The level needs to be optimized based on your workload and available resources.
- Monitor metrics like CPU usage, memory, storage and the number of running and queued queries to determine the right concurrency setting.
2) Use the result cache correctly
Snowflake offers three cache layers: result cache, local disk cache and remote disk cache, with result cache being the topmost and most vital layer.
- Result cache (Cloud Services Layer): Stores the full result set of a previously executed query
- Warehouse cache (local SSD): Caches raw micro-partition data on warehouse nodes for fast re-reads
- Remote storage (object storage): S3, Azure Blob, or GCS; the source of truth
When you run a query, Snowflake stores the result in the result cache. If you (or another user with the same role) run the same query again within 24 hours, and the underlying table data hasn’t changed, Snowflake skips execution entirely and returns the cached result. No warehouse compute is consumed.
That 24-hour window resets each time the cached result is reused, but there’s an absolute cap: after 31 days from the original execution, the result is purged regardless of how often it’s been accessed.
The result cache is enabled by default. You can disable it at the session, user, or account level using the USE_CACHED_RESULT parameter:
-- Disable for the current session (useful for testing)

ALTER SESSION SET USE_CACHED_RESULT = FALSE;
Conditions for cache reuse
The result cache only kicks in when:
- The query text matches a prior query syntactically
- The underlying micro-partitions referenced by the query haven’t changed
- The user runs the query under the same role as the original execution
- The query doesn’t include non-deterministic functions like CURRENT_TIMESTAMP() or RANDOM()
One subtle point worth knowing: the result cache is shared across users within the same account. If one user runs a query and another user with the same role runs the identical query within 24 hours, the second user benefits from the first user’s cached result. This makes the cache surprisingly powerful in teams running standard reports.
To access the cached results of a previously run query directly, use RESULT_SCAN:
SELECT *
FROM TABLE(RESULT_SCAN(LAST_QUERY_ID()));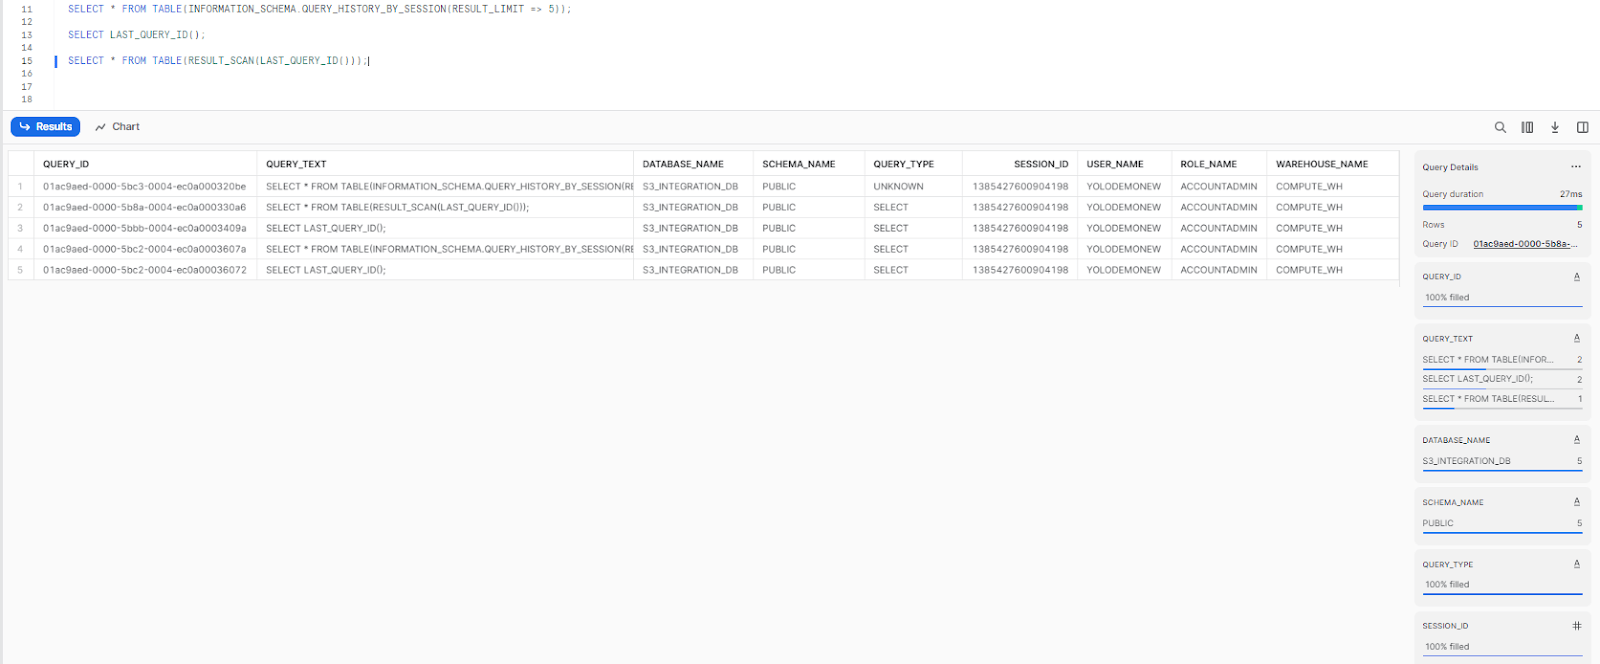
Note: RESULT_SCAN doesn’t guarantee the same row order as the original query. Add an ORDER BY clause if sequence matters.
3) Address row explosion in queries
Row explosion happens when a query generates far more rows during execution than exist in the original dataset. It’s a silent performance killer: your query might touch a modest table but briefly materialize millions of intermediate rows in memory, burning compute and time.
Here are the techniques that actually work.
a) Review your data types and filter early
Oversized data types inflate the memory footprint of every operation. Cast to more compact types where appropriate, and apply filters as early as possible to cut the data volume before any joins or aggregations run.
SELECT column1, CAST(column2 AS VARCHAR(10))
FROM your_table
WHERE column3 = 'some-value';
b) Rewrite subqueries as joins or CTEs
Correlated subqueries can cause repeated full table scans. Converting them to joins or common table expressions (CTEs) lets Snowflake optimize execution more effectively.
WITH subquery AS (
	SELECT column1
	FROM table1
	 WHERE column2 = 'value'
)
SELECT column1, COUNT(*)
FROM subquery
JOIN table2 ON subquery.column1 = table2.column1
GROUP BY column1;
c) Use DISTINCT deliberately
DISTINCT removes duplicates, which reduces downstream row counts. It’s worth applying when you’re querying a large fact table and only need unique dimension values.
SELECT DISTINCT col1, col2
FROM large_fact_table
That said, DISTINCT isn’t free. It triggers a sort operation, so use it where it genuinely reduces work rather than as a catch-all.
d) Avoid Cartesian products
A Cartesian product (the result of joining two tables with no join condition) multiplies every row in one table against every row in the other. Even modestly sized tables can produce billions of rows this way. Always verify your join conditions are correctly specified.
SELECT *
FROM table1
JOIN table2 ON table1.common_column = table2.common_column;
e) Break complex queries into temporary tables
When a query chains together multiple joins and subqueries, the intermediate row counts can balloon at each step. Staging intermediate results into temporary tables gives you control over what gets carried forward.
-- Create temporary table
CREATE TEMPORARY TABLE temp_table AS
SELECT column1, column2
FROM table1
JOIN table2 ON table1.id = table2.id;

-- Use the temporary table in subsequent operations
SELECT column1, COUNT(column2)
FROM temp_table
GROUP BY column1;
4) Optimize query pruning for better performance
Pruning is Snowflake’s mechanism for skipping micro-partitions that don’t contain relevant data. When a query includes a filter predicate, Snowflake evaluates the metadata stored for each Snowflake micro-partitions — min/max values, distinct value counts, row counts — and eliminates partitions that can’t possibly satisfy the filter. The less data Snowflake has to scan, the faster your query runs.
Pruning works well when data arrives naturally ordered along query dimensions, like date or region. It works poorly when data is loaded in random order or when DML operations (inserts, updates, deletes, merges) scatter related rows across many micro-partitions.
Improving pruning with clustering keys
When natural clustering degrades, you can define a clustering key to physically co-locate similar data. This makes partition elimination more aggressive.
To add a clustering key when creating a table:
CREATE OR REPLACE TABLE cluster_demo_table (
    id        NUMBER(10, 0),
    name      VARCHAR(100),
    age       NUMBER(3, 0),
    country   VARCHAR(50)
)

CLUSTER BY (age);
To add or change a clustering key on an existing table:
ALTER TABLE cluster_demo_table CLUSTER BY (age);
⚠️ Important: The ALTER TABLE … CLUSTER BY statement only specifies the clustering key. You do not re-declare column definitions in this statement. Doing so will throw a syntax error.
You can also define multi-column clustering keys or use expressions:
-- Multi-column key

ALTER TABLE cluster_demo_table CLUSTER BY (country, age);

-- Expression-based key

ALTER TABLE cluster_demo_table CLUSTER BY (YEAR(signup_date), country);
When defining multiple clustering columns, order matters. Snowflake recommends placing lower-cardinality columns first. A column like country (dozens of distinct values) should come before a column like user_id (millions of distinct values).
When should you cluster a table?
Clustering has real costs. Snowflake’s Automatic Clustering service continuously reclusters your data as DML operations degrade the clustering quality, and that process consumes credits. It’s worth the cost when:
- The table is large (hundreds of millions of rows or more)
- Queries consistently filter on the same columns
- You can see from the query profile that a large proportion of micro-partitions are being scanned despite narrow filter conditions
Note: Manual reclustering via SYSTEM$CLUSTERING_INFORMATION was deprecated as of May 2020. Snowflake now handles reclustering automatically. Use ALTER TABLE … SUSPEND RECLUSTER and RESUME RECLUSTER to control when Automatic Clustering runs.
Check the Snowflake Clustering 101 guide for a deeper treatment of clustering key selection strategy.
5) Managing and Monitoring Disk Spillage
Disk spillage is what happens when a warehouse runs out of memory to complete an operation. Snowflake first tries to spill to local SSD on the warehouse nodes. If that fills up too, it spills to remote object storage. You can spot spillage in the query profile under “Bytes spilled to local storage” and “Bytes spilled to remote storage.”
Local spillage slows queries noticeably. Remote spillage can be an order of magnitude worse.
How to reduce disk spillage
Scale up the warehouse. More nodes means more aggregate memory and local SSD, which lets large operations complete in memory. The following increases warehouse size, enables auto-suspend after 300 seconds of inactivity, and sets the warehouse to auto-resume:
ALTER WAREHOUSE my_warehouse SET

    WAREHOUSE_SIZE  = 'LARGE'

    AUTO_SUSPEND    = 300

    AUTO_RESUME     = TRUE;

ALTER WAREHOUSE my_warehouse RESUME;
Rewrite spill-heavy queries. Large hash joins, sorts, and window functions are the most common sources of spillage. Look at the query profile and identify which node is generating the spill. Often, reordering joins (putting the smaller table on the right side of a hash join) or pushing filters earlier in the query reduces the working set enough to keep everything in memory.
Improve partition pruning. The less data a query scans, the less memory it needs. Proper clustering keys and early filter application directly reduce spillage risk.
Project only the columns you need. SELECT * forces Snowflake to carry every column through each stage of execution. Selecting only the columns your query actually uses shrinks the in-memory footprint.
-- Instead of SELECT *

SELECT column1, column2

FROM table1

WHERE column3 = 'value';
Limit parallel query execution. Running too many concurrent queries on the same warehouse increases memory pressure across the board. Reducing MAX_CONCURRENCY_LEVEL gives each query more breathing room:
ALTER WAREHOUSE my_warehouse SET MAX_CONCURRENCY_LEVEL = 5;
Save up to 30% on your Snowflake spend in a few minutes!
Conclusion
And that’s a wrap! Snowflake handles enormous data volumes well, but it doesn’t automatically tune itself for your specific workloads. Here’s a quick recap of what we covered:
- Reduce queuing by setting STATEMENT_QUEUED_TIMEOUT_IN_SECONDS and tuning MAX_CONCURRENCY_LEVEL to match your actual workload
- Leverage result caching by understanding what invalidates it (data changes, role mismatches, non-deterministic functions) and structuring queries to take advantage of it
- Prevent row explosion by filtering early, rewriting correlated subqueries, using DISTINCT where it actually helps, and staging intermediate results in temporary tables
- Improve partition pruning by defining clustering keys on large, frequently queried tables, especially when natural clustering has degraded
- Control disk spillage by scaling up the warehouse, rewriting spill-heavy operations, and projecting only the columns you need
This is Part 3 of our Snowflake performance tuning series. Check out Part 1 and Part 2 if you haven’t already.
FAQs
What are some common Snowflake performance tuning techniques?
The most impactful ones are query optimization (reducing scanned data, rewriting inefficient joins), data clustering, result cache utilization, warehouse sizing, and disk spillage management.
How does query optimization improve Snowflake performance?
Optimized queries scan less data, produce fewer intermediate rows, and make better use of cached results. Less work means lower latency and fewer compute credits consumed.
What is the role of data clustering in Snowflake performance tuning?
Clustering keys co-locate related data in adjacent micro-partitions, which makes partition pruning more aggressive. When a query filters on a clustered column, Snowflake can skip large portions of the table instead of scanning everything.
How does warehouse size affect Snowflake performance?
Larger warehouses have more nodes, more aggregate memory, and more local SSD. This lets Snowflake process large operations in memory rather than spilling to disk, and it reduces queuing under concurrent load. The tradeoff is higher credit consumption, so right-sizing your warehouse to the workload matters.
Can caching improve Snowflake performance?
Yes, significantly. Snowflake’s result cache can return query results without consuming any warehouse compute at all, as long as the underlying data hasn’t changed and the query matches a prior execution. For repeated analytical queries on relatively stable data, this is a major cost and latency saver.
How do you check Snowflake performance?
Start with Snowsight’s Query Profile and Query History views. The Query Profile breaks down execution time by node and surfaces specifics like bytes scanned, spillage, and pruning efficiency. For account-wide analysis, query the ACCOUNT_USAGE.QUERY_HISTORY view in the SNOWFLAKE database. Third-party observability tools can also surface trends across warehouses and over time.
What makes Snowflake fast?
Several architectural choices work together: separation of compute and storage (each scales independently), columnar storage with micro-partition-level metadata for efficient pruning, multi-layer caching (metadata, result, warehouse), and massively parallel query execution across warehouse nodes.
How do you handle long-running queries in Snowflake?
Query ACCOUNT_USAGE.QUERY_HISTORY to identify long-running queries by execution time or bytes scanned. You can cancel a running query using SYSTEM$CANCEL_QUERY(‘<query_id>’). For ongoing control, set STATEMENT_TIMEOUT_IN_SECONDS at the warehouse or session level to automatically cancel queries that exceed a time threshold.
What is the difference between STATEMENT_TIMEOUT_IN_SECONDS and STATEMENT_QUEUED_TIMEOUT_IN_SECONDS?
STATEMENT_TIMEOUT_IN_SECONDS limits how long a query can actively run before Snowflake cancels it. STATEMENT_QUEUED_TIMEOUT_IN_SECONDS limits how long a query can sit in the queue waiting to start. Both are useful, but they address different problems. The default for STATEMENT_TIMEOUT_IN_SECONDS is 172800 seconds (two days). The default for STATEMENT_QUEUED_TIMEOUT_IN_SECONDS is 0, meaning no queue timeout is enforced by default.
When should you not add a clustering key?
Clustering isn’t always worth it. Small tables, tables that are infrequently queried, or tables where query patterns don’t consistently filter on the same columns are poor candidates. Automatic Clustering consumes credits continuously, so applying it to tables that don’t benefit enough to offset that cost is a net loss. Always validate clustering decisions against actual query patterns and query profile data.
How do you disable result caching for testing?
Run ALTER SESSION SET USE_CACHED_RESULT = FALSE; before your test queries. This forces Snowflake to execute the query from scratch, which gives you an accurate read on true execution time. Re-enable it with ALTER SESSION SET USE_CACHED_RESULT = TRUE; when you’re done.