Table of contents
Do not edit: TOC will be auto-generated
Flexera’s 2024 State of ITAM Report highlights the latest IT asset management (ITAM) trends and statistics, including strategies, challenges and initiatives from a broad cross-section of industries and organizations. It draws on the wisdom of 503 IT professionals and executive leaders from a survey conducted in the beginning of 2024 and highlights year-over-year (YoY) changes to help identify trends. As in previous years, the 2024 State of ITAM Report provides insights into the makeup and focus of ITAM teams at enterprise-level organizations and offers perspective and advice on these current trends. The report takes a high-level view of IT investments across on-premises, public, hybrid and SaaS technologies.
Select highlights of the State of ITAM Report are included below.
Terminology used:
- CCOE: Cloud center of excellence
- C-level/C-Suite: Describes the grouping of high-ranking business leaders with “chief” in their title.
- Enterprise organizations: Public or private sector companies with 1,000 or more employees
- HAM: Hardware asset management
- IaaS: Infrastructure as a service
- ITAM: IT asset management
- PaaS: Platform as a service
- SaaS: Software as a service
- SAM: Software asset management
ITAM’s importance in organizations is increasing
ITAM has become more strategic in C-level eyes. Almost half of respondents (46%) say that their ITAM teams now report directly to the CIO or CTO. This is up from 40% last year’s report and up from 22% from the year prior.
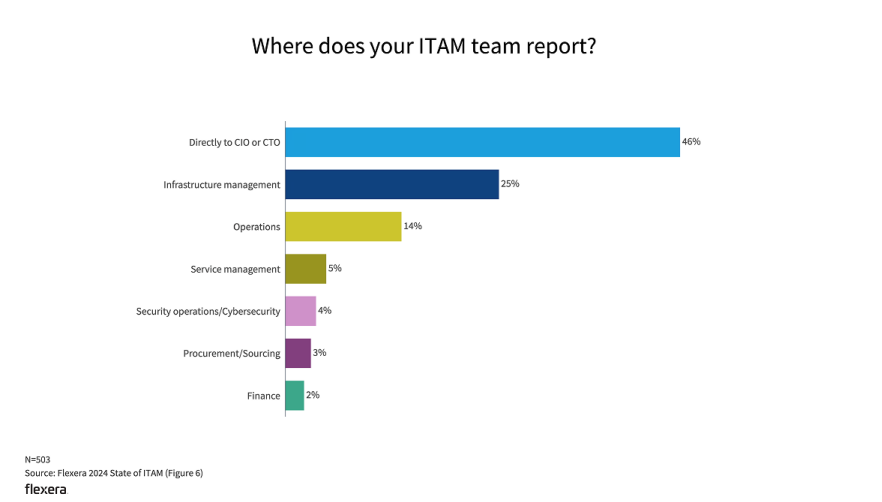
Nearly half of ITAM teams report directly to the CIO or CTO, reinforcing ITAM’s strategic role in IT leadership.
ITAM/SAM teams are increasingly contributing to the CCOE
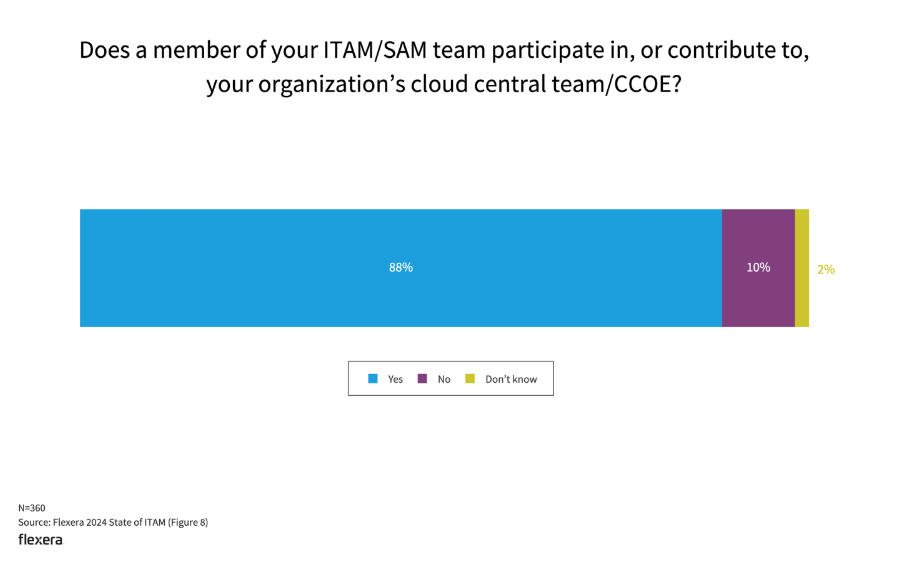
88% of organizations involve ITAM in their cloud center of excellence, signalling strong alignment with cloud governance.
As more software models move to SaaS and the cloud, ITAM practitioners’ expertise is becoming more essential to incorporate software licensing into cloud-cost planning and deployment.
Wasted spend is improving
Wasted IT spend has improved compared to prior years but still remains a challenge. Unsurprisingly, ITAM beginners are finding that their IT spend is wasted more significantly than their more experienced counterparts.
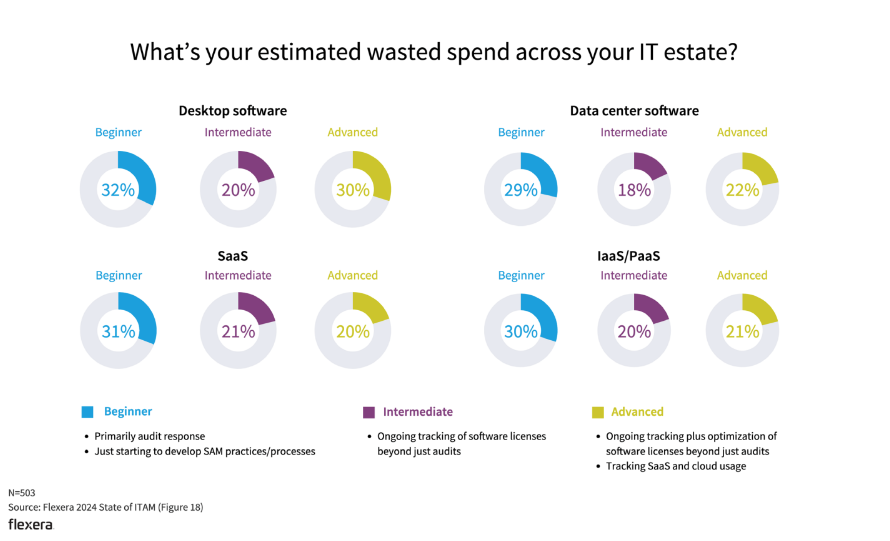
ITAM maturity reduces waste, with beginners reporting significantly higher wasted spend across software, SaaS, and cloud.
Significant challenges remain in optimizing software
Finding ways to optimize software use has increased from last year (31% vs. 37% YoY) and is the most significant SAM challenge for ITAM practitioners. Dealing with new environments such as SaaS, cloud, and containers is also a significant challenge with 36% of respondents finding it difficult.
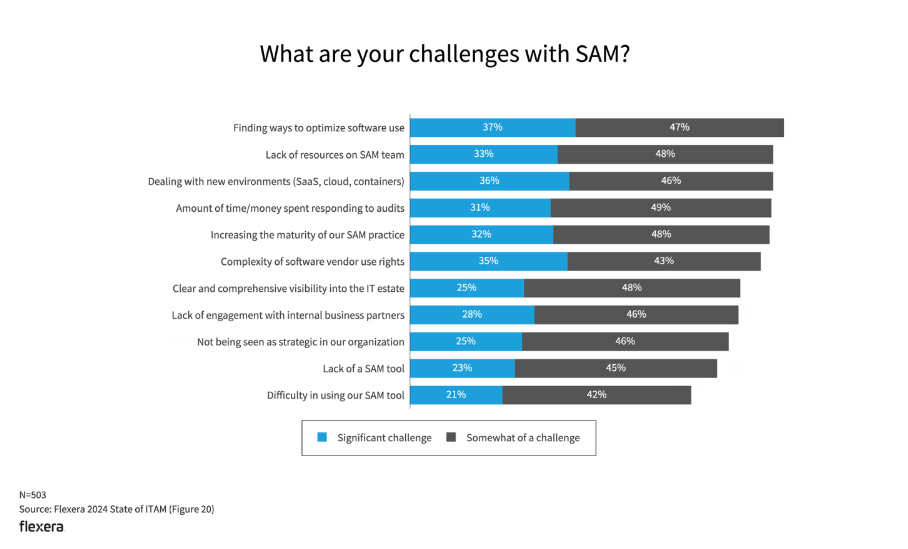
Optimising software use and limited SAM resources are the biggest challenges organizations face.
Sustainability is a top priority for enterprises
Almost all organizations surveyed have some plan in place for their aging hardware (95%), with more than half utilizing longer retention periods and reuse.
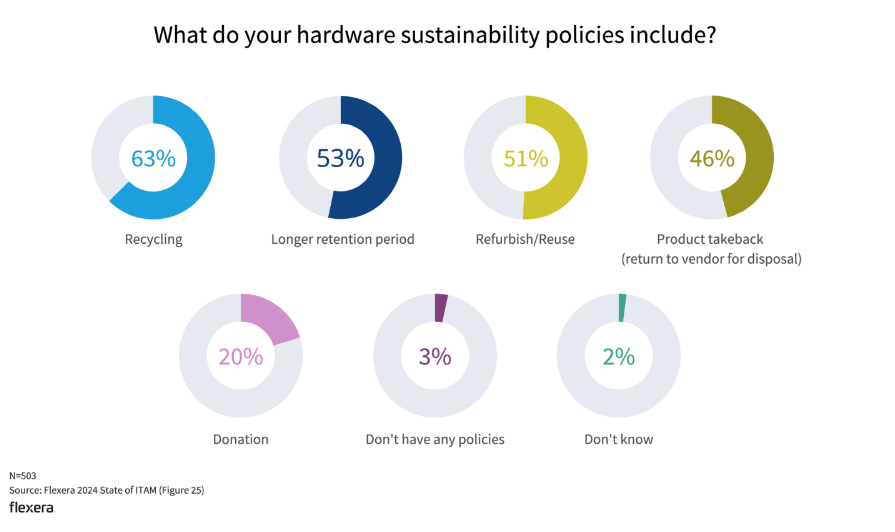
Recycling and longer hardware lifecycles lead sustainability efforts, with most organizations adopting multiple policies.
Vendor audits are common
Microsoft, IBM, and Oracle are the most likely vendors to have audited respondents in the past three years, but SaaS providers are also becoming more common. Salesforce audited 25% of respondents, and ServiceNow audited 20%.

Microsoft and IBM lead vendor audits, with half of organizations reporting Microsoft audits in the past three years.
Audits are time consuming
Despite the advancement of ITAM practices and tools improving usability and allowing deeper insights, the growing complexity of hybrid IT estates means audits are still a big time sink.
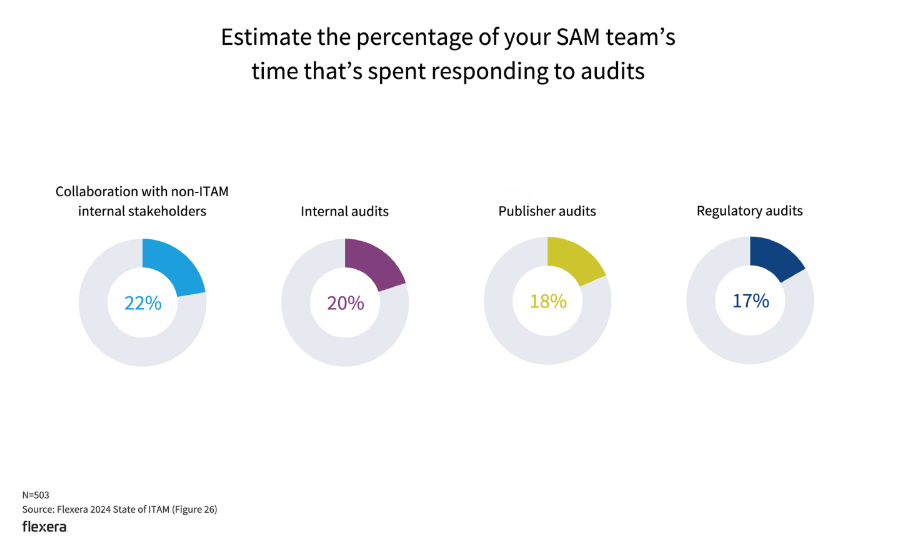
SAM teams spend a significant portion of their time on audit-related activities, including internal, publisher, and regulatory audits.
Audits are expensive
Software audits continue to become more expensive. Twenty-two percent of respondents said they paid more than $5 million due to software vendor audits over the last three years (up from 15% in 2023 and 9% in 2022). Organizations who spent more than $10 million nearly doubled from last year (7% to 12% YoY).
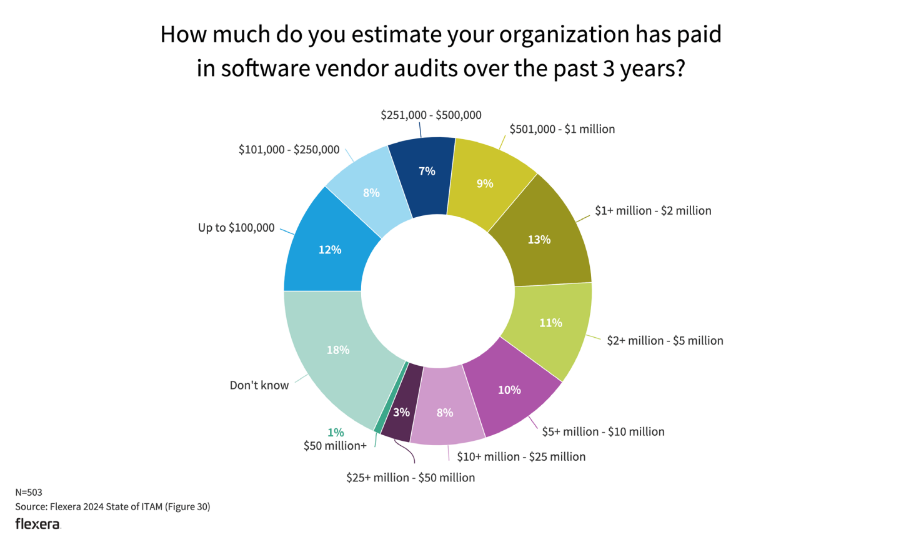
Software audit costs vary widely, with a significant share of organizations paying over $1M in the past three years.
Success metrics for SAM and HAM are focused on savings money
Unsurprisingly, ITAM success metrics are focused on cost savings initiatives. Nearly half of respondents reported that audit compliance, hard savings on software and reduction in hardware purchases were the leading initiatives.

Audit compliance and cost savings lead how organizations measure SAM success.
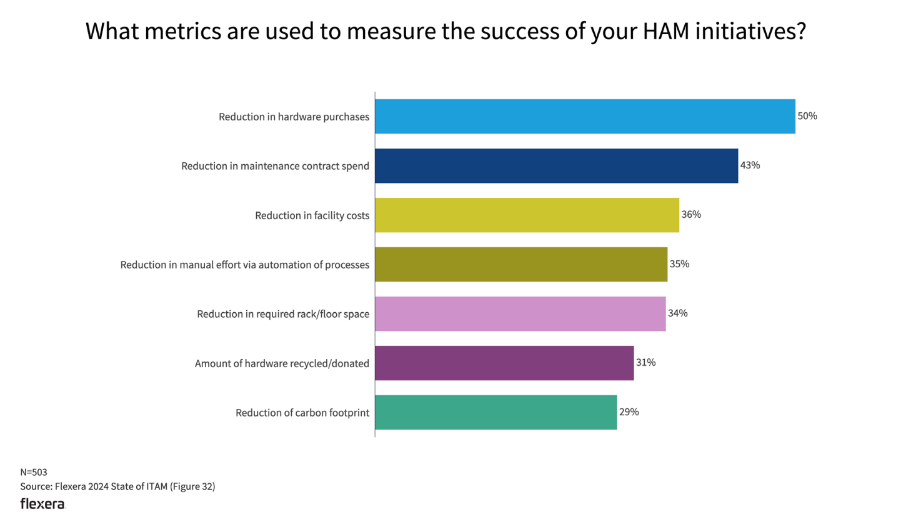
Reduced hardware purchases and maintenance spend are the primary measures of HAM success.
Flexera’s ITAM solutions can help you meet your cost-saving objectives
Our ITAM tools can help you optimize your software licenses, avoid penalties and compliance issues, improve your purchasing decisions and enable better budgeting and forecasting decisions. Whether you want to get a better handle on your SaaS subscriptions, need assistance in lowering your HAM spend or have complex SAM licensing requirements, Flexera has the right solution for you.