
Snowflake is a powerful cloud data platform, but it’s also one of the easier services to accidentally overspend on. If your Snowflake costs have been climbing without a clear explanation, you’re not the only one. This guide covers 8 concrete practices for Snowflake cost optimization that actually move the needle, from right-sizing your warehouses to cleaning up storage you’ve forgotten about.
How does Snowflake pricing work?
To understand the ins and outs of Snowflake cost optimization, it’s important to understand how Snowflake pricing works. Snowflake pricing can be complex and hard to understand at first, which leaves many users struggling to reduce Snowflake costs.
When it comes to Snowflake costs, there are three main areas to consider:
- Compute costs
- Storage costs
- Data transfer costs
Snowflake compute costs
Compute is where the bulk of your bill lives, typically 60 to 80% of total spend. Every time you run a query or load data, a virtual warehouse (a cluster of CPU, memory and temporary SSD storage) is doing the work. Snowflake charges you in credits, billed per second with a 60-second minimum on every warehouse start. That minimum matters more than people realize: a query that finishes in 8 seconds still costs you 60 seconds of credits.
Warehouses come in ten T-shirt sizes, and each step up doubles both compute power and credit consumption:
| Warehouse size | Credits / hour (Gen1 warehouses) | Credits / second (Gen1 warehouses) |
|---|---|---|
| X-Small | 1 | 0.0003 |
| Small | 2 | 0.0006 |
| Medium | 4 | 0.0011 |
| Large | 8 | 0.0022 |
| X-Large | 16 | 0.0044 |
| 2X-Large | 32 | 0.0089 |
| 3X-Large | 64 | 0.0178 |
| 4X-Large | 128 | 0.0356 |
| 5X-Large | 256 | 0.0711 |
| 6X-Large | 512 | 0.1422 |
For the exact per-credit rate for your account see the Snowflake pricing guide.
Credit rates aren’t fixed. They depend on your Snowflake edition (Standard, Enterprise or Business Critical), your cloud provider, your region and whether you’re on on-demand or a prepaid capacity contract. On-demand rates typically run $2/credit (Standard), $3/credit (Enterprise) and $4/credit (Business Critical) in US regions. Prepaid capacity commitments can bring that down by 15 to 30% depending on term length and volume, so they’re worth looking at once your spend is predictable. For exact rates, check Snowflake’s official pricing guide.
One more thing the original pricing section commonly omits: the cloud services layer. Snowflake runs metadata operations, query compilation and security checks in a shared cloud services layer. This is free up to 10% of your daily compute spend. If you exceed that threshold, Snowflake starts billing it as additional credits. Most teams never hit this limit, but workloads with very large IN lists, heavy COPY INTO usage or poor query selectivity can push you over it.
Snowflake storage costs
Snowflake bills storage as a flat rate per compressed terabyte per month, calculated from your average daily compressed bytes and accrued daily. In US regions on-demand, that rate runs around $40/TB. Because Snowflake’s compression typically shrinks raw data by 3–5x, your effective cost on raw data is considerably lower than that headline number suggests.
What catches teams off guard is that storage isn’t just active table data. Your bill also includes:
- Time Travel bytes (historical micro-partitions kept so you can query or restore past data. Default is 1 day retention and up to 90 days on Enterprise)
- Fail-safe bytes (additional 7-day non-configurable recovery window that Snowflake maintains after Time Travel expires)
- Internal stage files (data staged for loading that nobody cleaned up)
- Zero-copy clone metadata (retained bytes from clones that track back to the original table)
Replication adds another layer. Replicated or failover copies count toward storage in the target account and replication incurs both data transfer and compute charges on top of that.
Snowflake Data transfer costs
Snowflake charges data egress on a per-byte basis when you transfer data out of a Snowflake account to a different region or to a different cloud provider; transfers within the same cloud region and cloud are typically free.
Snowflake does not charge for data ingress.
Operations that commonly trigger egress charges include cross-region replication and failover, unloading data to external cloud storage and cross-cloud sharing; these transfers incur per-byte fees that reflect Snowflake’s billing and the underlying cloud provider egress rates.
Data transfer costs are often small compared with compute, but they can become significant in multi-region or multi-cloud architectures, so treat them as a material cost when you design global or multi-cloud systems.
Track transfers using the DATA_TRANSFER_HISTORY and DATA_TRANSFER_DAILY_HISTORY views and reduce egress by co-locating workloads, minimizing unnecessary copies. And use Snowflake’s Egress Cost Optimizer, launched in April 2025, to reduce cross-cloud egress costs significantly through intelligent caching in Snowflake-managed storage.
How to reduce Snowflake costs?
1) Right-size your warehouses
The most common (and expensive) mistake in Snowflake is running warehouses that are too big for the queries they serve. A bigger warehouse doesn’t always mean faster results. For many workloads, jumping from Small to Medium doubles your credit burn without meaningfully changing query time, because the bottleneck is I/O, not compute parallelism.
Here’s the counterintuitive reality: a warehouse that’s slightly too small for a query will take longer to run but may still cost less in total credits than a warehouse that’s too large and finishes in a fraction of the time. The math depends on your specific workload.
A good starting approach is to run your query against an X-Small or Small warehouse first, then step up one size at a time until you hit diminishing returns on query time. Track both elapsed time and credits consumed (not just time) so you’re making the comparison honestly.
To change warehouse size on the fly, use:
ALTER WAREHOUSE COMPUTE_WH
--RESUME
SET WAREHOUSE_SIZE = XSmall;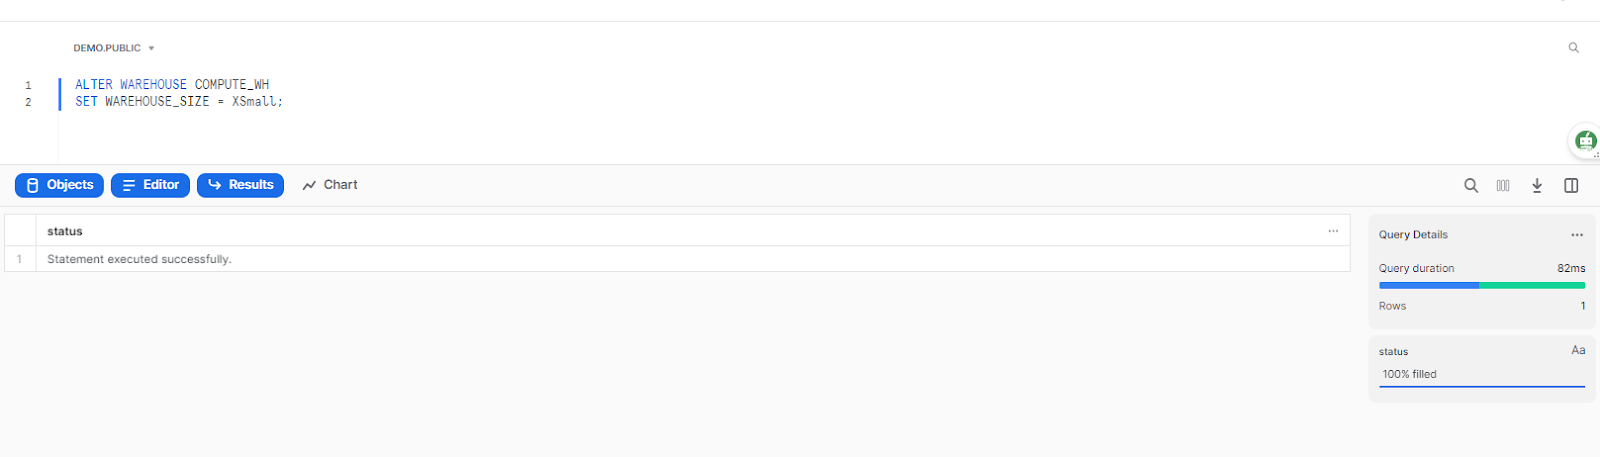
Replace COMPUTE_WH with your warehouse name and “XSmall” with your target size. You can also do this through the Snowflake UI under Admin > Warehouses.
If your main issue is concurrency (many users hitting the same warehouse simultaneously) rather than query size, scaling up won’t help. In that case, a multi-cluster warehouse (Enterprise Edition feature) that scales out to additional clusters of the same size is the right tool. You set MIN_CLUSTER_COUNT and MAX_CLUSTER_COUNT and let Snowflake spin up extra clusters during peak load, then shut them down when the rush subsides.
2) Tune your auto-suspend settings (carefully)
Warehouses accrue credits every second they’re running, whether they’re processing queries or just sitting idle. Auto-suspend stops the clock by suspending the warehouse after a configured period of inactivity. The default is 600 seconds (10 minutes), and for most workloads that’s genuinely too long.
Here is the catch: Setting auto-suspend aggressively low (say, 60 seconds across the board) can actually cost you more, not less.
Here’s why: when a warehouse suspends, its local SSD cache is cleared. The next time it starts, it has to re-read micro-partitions from remote cloud storage, which is slower and can result in queries taking longer. If your workload involves frequent queries with short gaps between them, constantly suspending and resuming forces repeated 60-second minimum charges and cold-cache query times.
The right setting depends on your workload type:
- Batch/ETL warehouses: Set auto-suspend as low as 60 seconds or even lower. These jobs run on a schedule with long gaps between runs, so idle compute is pure waste and cache warmth doesn’t help.
- BI and reporting warehouses: A 5 to 10 minute window keeps the data cache warm for analyst sessions. Suspending too aggressively here will slow down dashboard queries and trigger repeated minimum-charge restarts.
- Ad-hoc and data science warehouses: 2 to 5 minutes is a reasonable middle ground.
To set auto-suspend on a warehouse:
via Snowsight
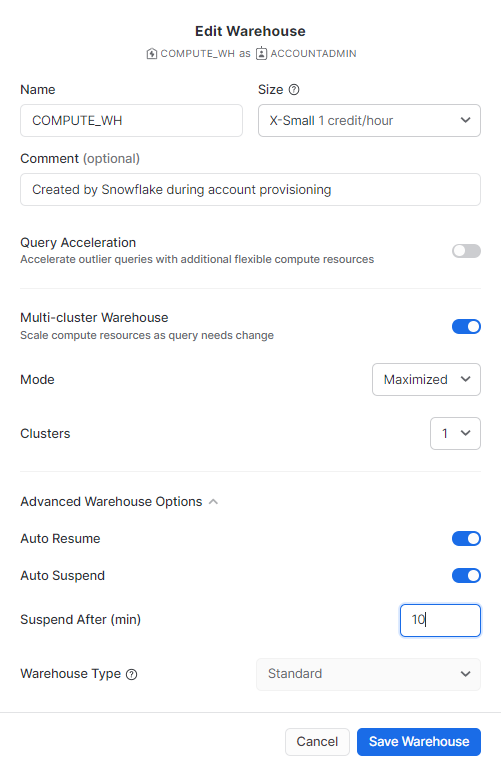
via Query
ALTER WAREHOUSE COMPUTE_WH SET AUTO_SUSPEND = 60 AUTO_RESUME = TRUE;
AUTO_RESUME = TRUE lets Snowflake automatically restart the warehouse when a query arrives, so users don’t have to manually resume it. Always pair auto-suspend with auto-resume.
Use SNOWFLAKE.ACCOUNT_USAGE.WAREHOUSE_METERING_HISTORY to find warehouses with high idle credit burn and investigate their suspend settings.
3) Leverage result set caching (it’s completely free)
This is one of the most impactful Snowflake features.
Snowflake maintains a result cache at the cloud services layer. When the same query text runs within 24 hours and the underlying data hasn’t changed, Snowflake returns the cached result instantly, without spinning up a warehouse at all. No compute cost. Zero credits burned.
For BI dashboards and repeated reporting queries, this is a significant lever. If five analysts run the same “weekly sales by region” report during the same day, only the first execution costs credits. The next four are free.
The cache works reliably when:
- The SQL text is byte-for-byte identical (even extra spaces or different casing will bypass it)
- The underlying table data hasn’t changed since the last execution
- The user has the same access privileges as the original query
The practical implication: standardize your SQL in your BI tooling. Use the same query string across all users and dashboard tiles instead of letting tools generate slightly different variants. It sounds like a very small issue, but teams that get this right cut their dashboard compute costs substantially.
You can verify whether a query hit the result cache by checking the Query Profile in Snowsight. Cached queries show up with “Query Result Reuse” in the profile.
4) Use materialized views strategically
Materialized views precompute and store the results of a query so subsequent reads hit the stored result rather than re-scanning the base table. For frequently-run, complex aggregations over large, slowly-changing datasets, they can cut query time and compute dramatically.
Note:
- Materialized views require Enterprise Edition. They’re not available on Standard. If you’re on Standard, this option isn’t on the table.
- Materialized views are not free to maintain. Snowflake uses serverless compute to keep materialized views up to date as the base data changes. That maintenance cost is billed in credits separately from your warehouse compute. If your base table changes frequently, the maintenance cost can outweigh the query savings. Materialized views work best when the base data changes infrequently but the query runs often.
Use them for:
- Aggregations your BI dashboards recalculate constantly (totals by day, totals by region)
- Complex joins over large, infrequently updated tables
- Queries on external or file-format tables where re-scanning is expensive
Skip them for:
- Tables with high update frequency (the maintenance credits will eat your savings)
- Queries that only run occasionally
To create a materialized view:
CREATE MATERIALIZED VIEW mv_daily_sales AS

  SELECT DATE_TRUNC('day', sale_date) AS sale_day, SUM(amount) AS revenue

  FROM raw_sales

  GROUP BY 1;
Monitor your materialized view maintenance costs using SNOWFLAKE.ACCOUNT_USAGE.MATERIALIZED_VIEW_REFRESH_HISTORY.
5) Tighten your query timeout settings
Snowflake has a default query timeout value of 172800 seconds, which is two days (48 hours).
A runaway or misconfigured query can burn an enormous amount of compute before Snowflake terminates it. On a Medium warehouse at $3/credit, a query that runs for 48 hours costs roughly $864. On a Large, that’s $1,728.
Setting a tighter timeout is a simple guard. You can apply it at the account, warehouse, user or session level:
Set at the warehouse level (applies to all queries on this warehouse):
ALTER WAREHOUSE COMPUTE_WH SET STATEMENT_TIMEOUT_IN_SECONDS = 3600;
Set at the account level (applies to all warehouses unless overridden):
ALTER ACCOUNT SET STATEMENT_TIMEOUT_IN_SECONDS = 3600;
Pick a value based on the longest legitimate query in your workload. If your longest normal query runs 30 minutes, a 1–2 hour timeout catches runaways without interrupting real work. There’s also STATEMENT_QUEUED_TIMEOUT_IN_SECONDS, which terminates queries that have been waiting in the queue too long without executing, which is useful for controlling concurrency backlog.
6) Set up resource monitors
Resource monitors let you define credit thresholds at the account or warehouse level, then take automatic action when those thresholds are hit. Actions include sending email notifications and suspending all warehouses under the monitor.
It is recommended to set the notification thresholds well below your hard limit. If your monthly budget is 1000 credits, set an alert at 75% (750 credits) and a hard suspend at 90% (900 credits). That gives you room to react before you run out.
To set the resource monitor:
via Snowsight
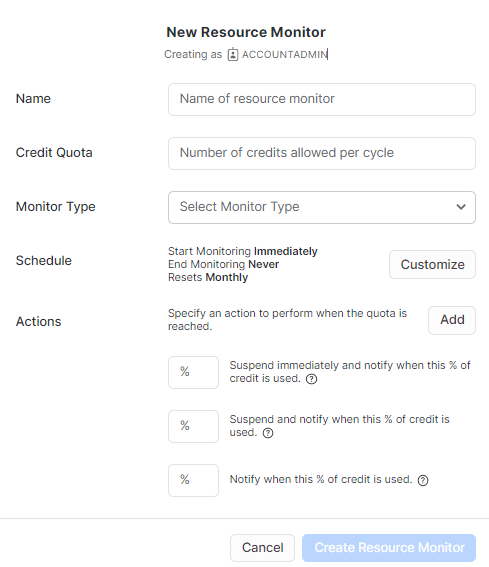
via Query
CREATE RESOURCE MONITOR monthly_budget

  WITH CREDIT_QUOTA = 1000

  TRIGGERS

    ON 75 PERCENT DO NOTIFY

    ON 90 PERCENT DO SUSPEND

    ON 100 PERCENT DO SUSPEND_IMMEDIATE;
Apply the monitor to a warehouse:
ALTER WAREHOUSE COMPUTE_WH SET RESOURCE_MONITOR = monthly_budget;
Resource monitors in Snowflake’s native tooling are useful but fairly blunt. They tell you when you’ve spent a lot; they don’t tell you why, which query caused it or which team drove the spike. For that level of visibility, third-party observability tools built for Snowflake (several are available) give you breakdown by query, user, warehouse and time window, which makes root-cause analysis much faster.
7) Optimize your queries
Query efficiency is where compute costs are won or lost. A poorly written query on a large table can burn an hour of credits in a single run. The same query, rewritten, might take five minutes.
Here are some few techniques:
Use Query Profile before tuning. Snowflake’s Query Profile (in Snowsight under query history) visualizes the execution plan and flags specific problems: exploding joins, queries that spill to disk (local or remote), inefficient partition pruning and stages where most of the time is being spent. Don’t guess; read the profile first.
Avoid SELECT *. Specify only the columns you need. Snowflake stores data in a columnar format, so scanning unnecessary columns adds both I/O and processing overhead.
Use clustering keys on large tables. Snowflake organizes data into micro-partitions. If your queries filter on a column that’s not ordered in those partitions, Snowflake has to scan every partition. Defining a clustering key on high-cardinality filter columns (like event_date or region) tells Snowflake to keep similar values in the same partitions, so it can skip the rest. Note that automatic clustering is a serverless feature with its own credit cost, so evaluate whether the query savings justify the maintenance overhead.
Push filters early. Make sure your predicates narrow the data as early as possible in your query logic. Filter before joining, not after.
Watch for cartesian products. Missing or incorrect join conditions can cause explosive result sets. Query Profile will surface these as joins with very high row multiplication.
Use the EXPLAIN command to preview the query execution plan without actually running the query:
EXPLAIN SELECT * FROM large_table WHERE event_date = '2026-01-01';
Check the output for full-table scans, high row estimates in join steps and any hint that partition pruning isn’t happening.
Isolate workloads on separate warehouses. Running a heavy ETL job on the same warehouse as interactive BI queries creates contention and forces both workloads to queue or slow down. A dedicated ETL warehouse and a dedicated BI warehouse, each appropriately sized, is cleaner and often cheaper than one oversized shared warehouse.
8) Cut unused storage: tables, clones and Time Travel
Data engineers tend to hold onto tables “just in case.” It’s understandable. But every table you don’t need is accumulating active storage, Time Travel storage and Fail-safe storage every day.
Unused tables are the obvious starting point. Query SNOWFLAKE.ACCOUNT_USAGE.TABLE_STORAGE_METRICS to find tables by their last modified date and storage footprint. Tables untouched for 90+ days in non-production environments are strong candidates for archiving or dropping.
SELECT table_schema, table_name, active_bytes, time_travel_bytes, failsafe_bytes,

       DATEDIFF('day', last_altered, CURRENT_TIMESTAMP()) AS days_since_modified

FROM snowflake.account_usage.table_storage_metrics

WHERE days_since_modified > 90

ORDER BY (active_bytes + time_travel_bytes + failsafe_bytes) DESC;
Time Travel and Fail-safe are the hidden storage multipliers. Every row change in a permanent table generates historical micro-partitions that Snowflake retains for your Time Travel window, then an additional 7 days for Fail-safe. If you have a 30-day Time Travel retention and your table changes daily, you’re storing roughly 37x the active table size. That’s not an exaggeration.
The fix is workload-appropriate retention periods:
Drop Time Travel to 1 day for a dev/staging table
ALTER TABLE dev_table SET DATA_RETENTION_TIME_IN_DAYS = 1;
Drop Time Travel entirely for regenerable data (use transient tables)
CREATE TRANSIENT TABLE staging_data (...);
Transient tables have Time Travel limited to 0 or 1 day and no Fail-safe period at all. For staging data, intermediate ETL tables and anything you can regenerate from source, transient tables are the right choice. They can cut storage costs dramatically compared to permanent tables.
Zero-copy clones can also accumulate unexpectedly. Clones are cheap to create (they share micro-partitions with the original table), but as the clone diverges from the original through updates, it generates its own Time Travel and Fail-safe storage billed to the clone’s owner. Audit your clones regularly and drop any that aren’t actively used.
Save up to 30% on your Snowflake spend in a few minutes!
Conclusion
And that’s a wrap! The only way to achieve Snowflake cost optimization is to try, experiment and dabble with these strategies! Don’t just settle; test out different strategies and track their performance over and over. Remember, there’s no single silver bullet here. The teams that get Snowflake costs under control combine several of these practices, measure the impact of each change and keep tuning. Snowflake compute dominates most bills, so warehouse sizing and auto-suspend settings tend to deliver the fastest wins. Result caching and query optimization compound those savings over time. Storage cleanup is slower-moving but adds up to real money in large accounts.
If you’re not sure where to start, pull your WAREHOUSE_METERING_HISTORY and TABLE_STORAGE_METRICS data for the past 30 days. Look for the five most expensive warehouses by total credits and the five largest tables by combined active, Time Travel and Fail-safe bytes. Those eight targets alone will tell you where to focus first.
FAQs
What drives Snowflake costs the most?
Compute is typically 60 to 80% of any Snowflake bill. Idle warehouses, oversized warehouses and runaway queries are the three main culprits. Storage and data transfer costs are real but usually secondary unless you have unusually high data churn or a multi-region architecture.
Can I automate Snowflake cost optimization?
Yes, and you should. Snowflake’s native auto-suspend and auto-resume features handle idle compute automatically. Resource monitors handle budget alerts and hard stops. For more granular automation like intelligent warehouse sizing, query routing and anomaly detection, third-party tools built for Snowflake FinOps can go further than native tooling.
Is a bigger Snowflake warehouse always faster?
Not always. For I/O-bound queries, adding more compute doesn’t help if the bottleneck is data scanning speed. For concurrency problems (many users, not slow individual queries), scaling out with multi-cluster warehouses is more effective than scaling up a single warehouse.
Can Snowflake’s pricing change?
Yes. Snowflake has updated its pricing model multiple times, including revisions to Snowpipe billing in late 2025 and the introduction of Cortex AI billing for hosted AI model usage. If you use serverless features or newer AI capabilities, monitor those line items carefully, as they can appear on invoices without prior budget allocation.
What are transient tables and when should I use them?
Transient tables behave like permanent tables but with a Time Travel maximum of 1 day and no Fail-safe period. Use them for staging tables, intermediate ETL results, temp aggregations and any data you can regenerate from source systems. The storage savings compared to permanent tables are substantial for high-churn data.
How do I find which queries are costing the most?
Query SNOWFLAKE.ACCOUNT_USAGE.QUERY_HISTORY and sort by CREDITS_USED_CLOUD_SERVICES or join it against WAREHOUSE_METERING_HISTORY to estimate per-query compute cost. You can also filter for queries where BYTES_SPILLED_TO_REMOTE_STORAGE > 0, which flags queries too large for warehouse memory and often expensive to run.
Does Snowflake charge for failed or cancelled queries?
Yes. Snowflake charges for every second a warehouse is active, including time spent on queries that ultimately fail or are manually cancelled. A query that runs for 20 minutes before you cancel it costs 20 minutes of warehouse credits.
What is the cloud services layer and when does it add to my bill?
The cloud services layer handles metadata operations, query compilation and authentication. It’s included free up to 10% of your daily compute spend. If you exceed that threshold, the excess is billed in credits. This rarely affects most teams but can show up with certain workload patterns like very large IN lists or heavy metadata operations.