
Organizations measuring their cloud footprint today are working from half the picture and they don’t know it.
I saw this firsthand in a recent conversation with a large European organization about Cloud Sustainability and our newest AI Sustainability capabilities. The team already understood the industry’s familiar problem: nobody agrees on which cloud emissions number is correct. Then we opened the data together and the conversation changed.
The lightbulb moment was simple. Their provider reports were telling one story. Independent carbon, water and electricity data told a much bigger one.
Why cloud emissions numbers don’t match
Cloud emissions data differs because providers and independent sources measure different things in different ways. Customers are rarely told which choices were made.
Three choices drive most of the gap:
- Accounting method: Market-based figures credit renewable energy purchases and certificates. Location-based figures reflect the grid powering the data center. The GHG Protocol Scope 2 Guidance sets out both methods and they can produce very different results for the same workload.
- Scope and boundaries: Some reports cover only operational electricity. Others add embodied emissions from hardware, construction and supply chains.
- Granularity and timing: Annual and regional averages smooth over the hour-by-hour reality of when and where workloads run.
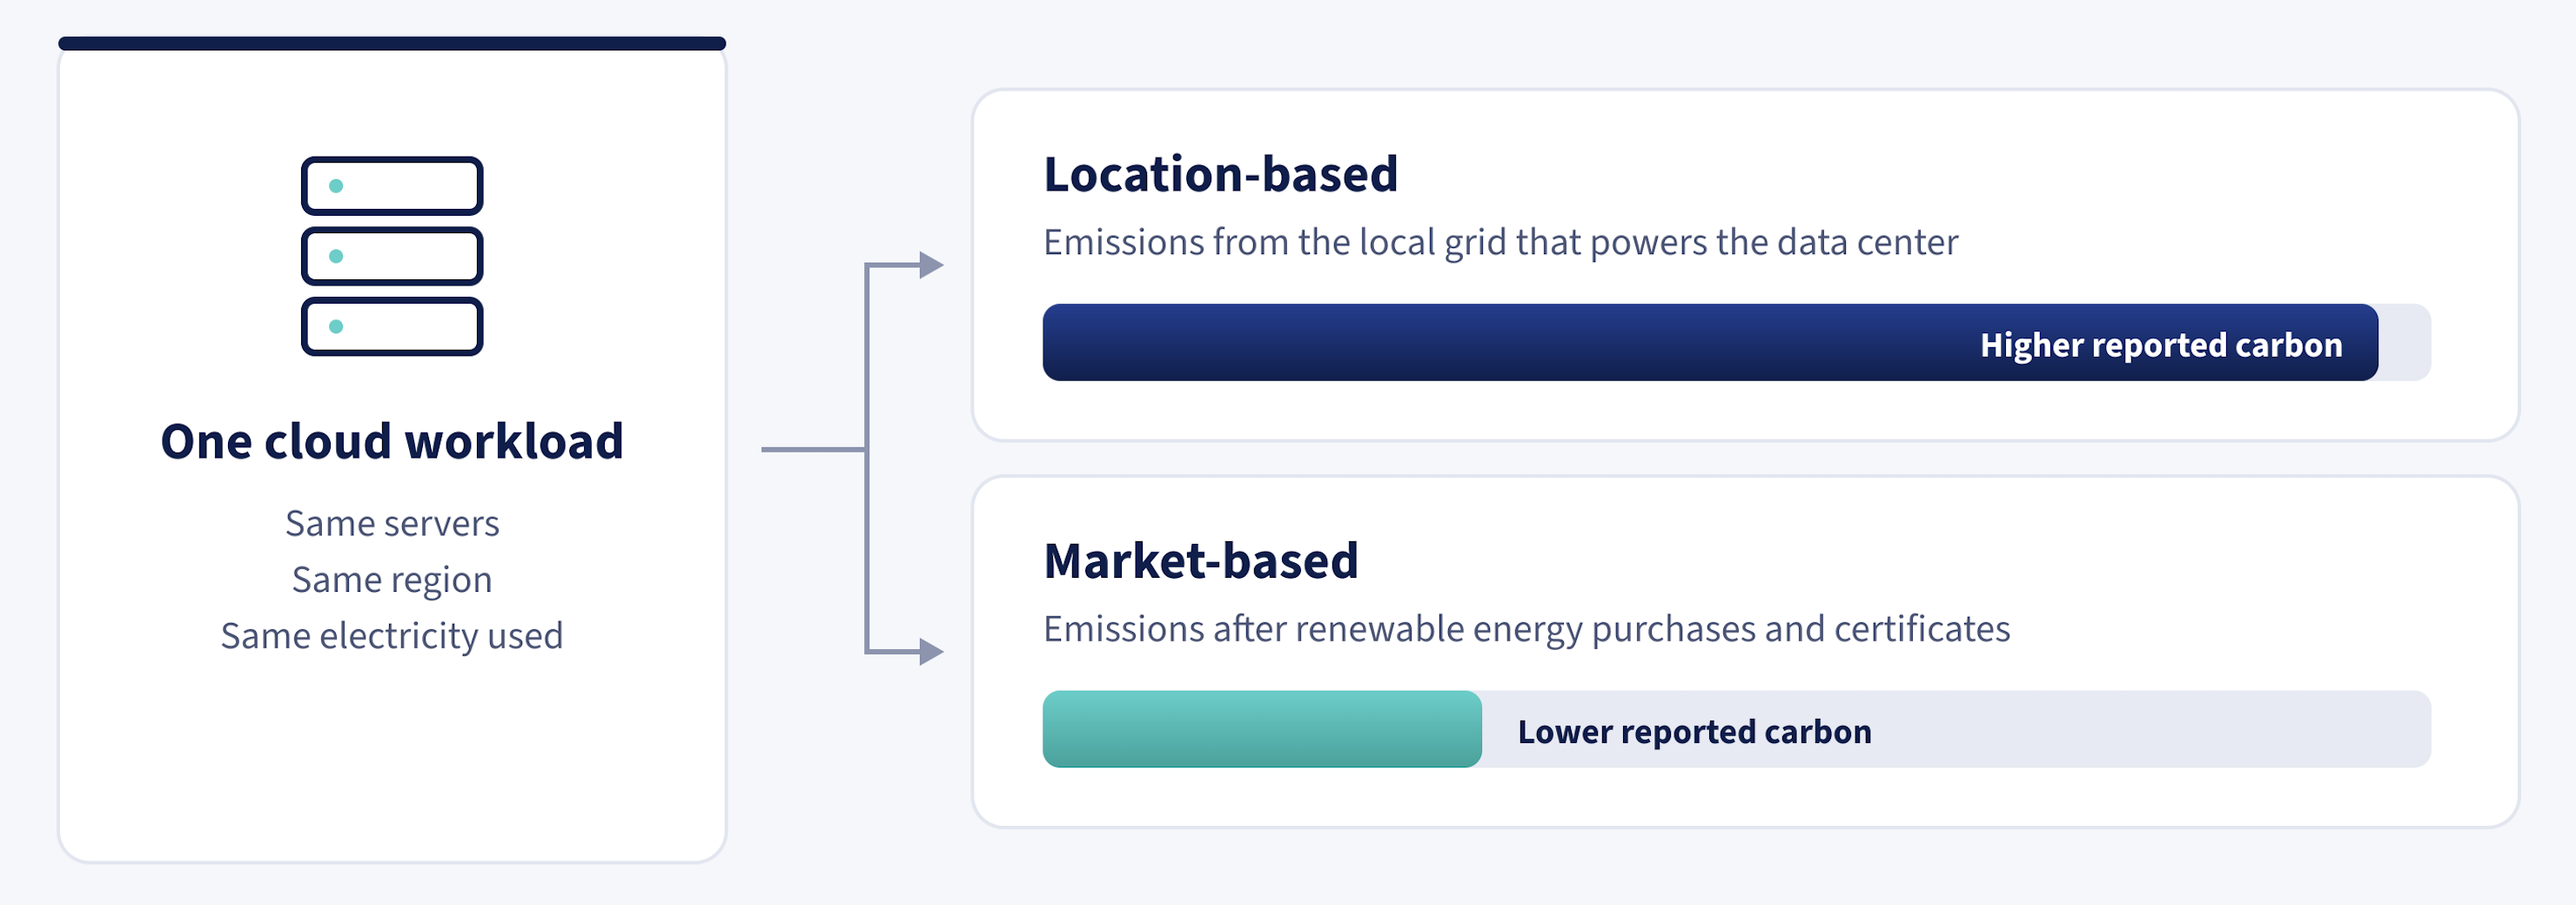
None of these choices is wrong on its own. The problem is when one lens is presented as the whole truth.
What a complete cloud footprint includes: carbon, water and electricity
Carbon gets the headlines, but it is only one of three connected resources every cloud workload consumes.
| Resource | What customers usually see | What the complete story includes |
| Carbon | A single emissions total, often market-based | Location-based and market-based views side by side, plus embodied emissions |
| Water | Little or nothing at the workload level | Cooling water and the water used to generate the electricity, tied to local water stress |
| Electricity | Rarely shown directly | Energy consumed, where it was drawn and the grid mix behind it |
These three move together. Shifting workload to a lower-carbon region can raise water use if that region relies on evaporative cooling in a dry climate. Looking at carbon alone can hide the tradeoff entirely.
How data centers affect local power grids and water supplies
Every data center sits within a community, drawing on a local power grid and watershed. That is what our customer saw once the data was in front of them.
A renewable energy certificate purchased elsewhere does not change the power plant running next door. It does not refill the local reservoir during a drought. It does not ease the strain on a regional grid that households and businesses also depend on.
When the full data is visible, sustainability stops being an abstract score. It becomes a clear view of the environmental impact your workloads create in specific places, for specific people.
Why cloud sustainability data matters more with AI
Reported impact and on-the-ground impact are drifting further apart and three forces are making that harder to overlook.
- AI is accelerating demand: Training and inference workloads are driving sharp growth in data center electricity and cooling needs. The Flexera 2026 AI Pulse Report shows AI adoption moving faster than teams can govern it. If you’re adopting AI, you need to understand its footprint before it scales.
- Reporting expectations are rising: Disclosure frameworks, including the EU’s Corporate Sustainability Reporting Directive (CSRD), build on the GHG Protocol’s requirement to report both location-based and market-based figures. A single provider number may not hold up under scrutiny. Flexera’s Cloud Sustainability breaks emissions out by scope at the resource level, so teams can show exactly where each figure comes from.
- Trust is on the line: Leaders who publish incomplete figures risk credibility with regulators, investors, employees and the communities they operate in.
Five questions to ask about your cloud footprint
Start by asking what your current numbers leave out. These five questions will surface most of the gap:
- Is this figure market-based, location-based, or both?
- Does it include embodied emissions from hardware and facilities?
- How much water do my workloads consume and in which watersheds?
- How much electricity do my workloads actually draw and from what grid mix?
- How does my footprint change by region and by hour, not just by year?
If your current reporting cannot answer these, you are seeing only part of the story.
How Flexera Cloud Sustainability shows the full footprint
The goal is not to discredit provider data. It is to put it in context alongside independent, location-aware carbon, water and electricity data.
That is what Flexera’s Cloud and AI Sustainability capabilities are built to do. Teams get resource-level visibility into carbon, electricity, water and cost across AWS, Microsoft Azure and Google Cloud. The figures come from ISO 14064-certified data provided by our partner, Greenpixie.
The Carbon Optimizer report adds estimated carbon, electricity and water savings to Cloud Cost Optimization recommendations, so a single rightsizing decision shows both the cost and the environmental impact.
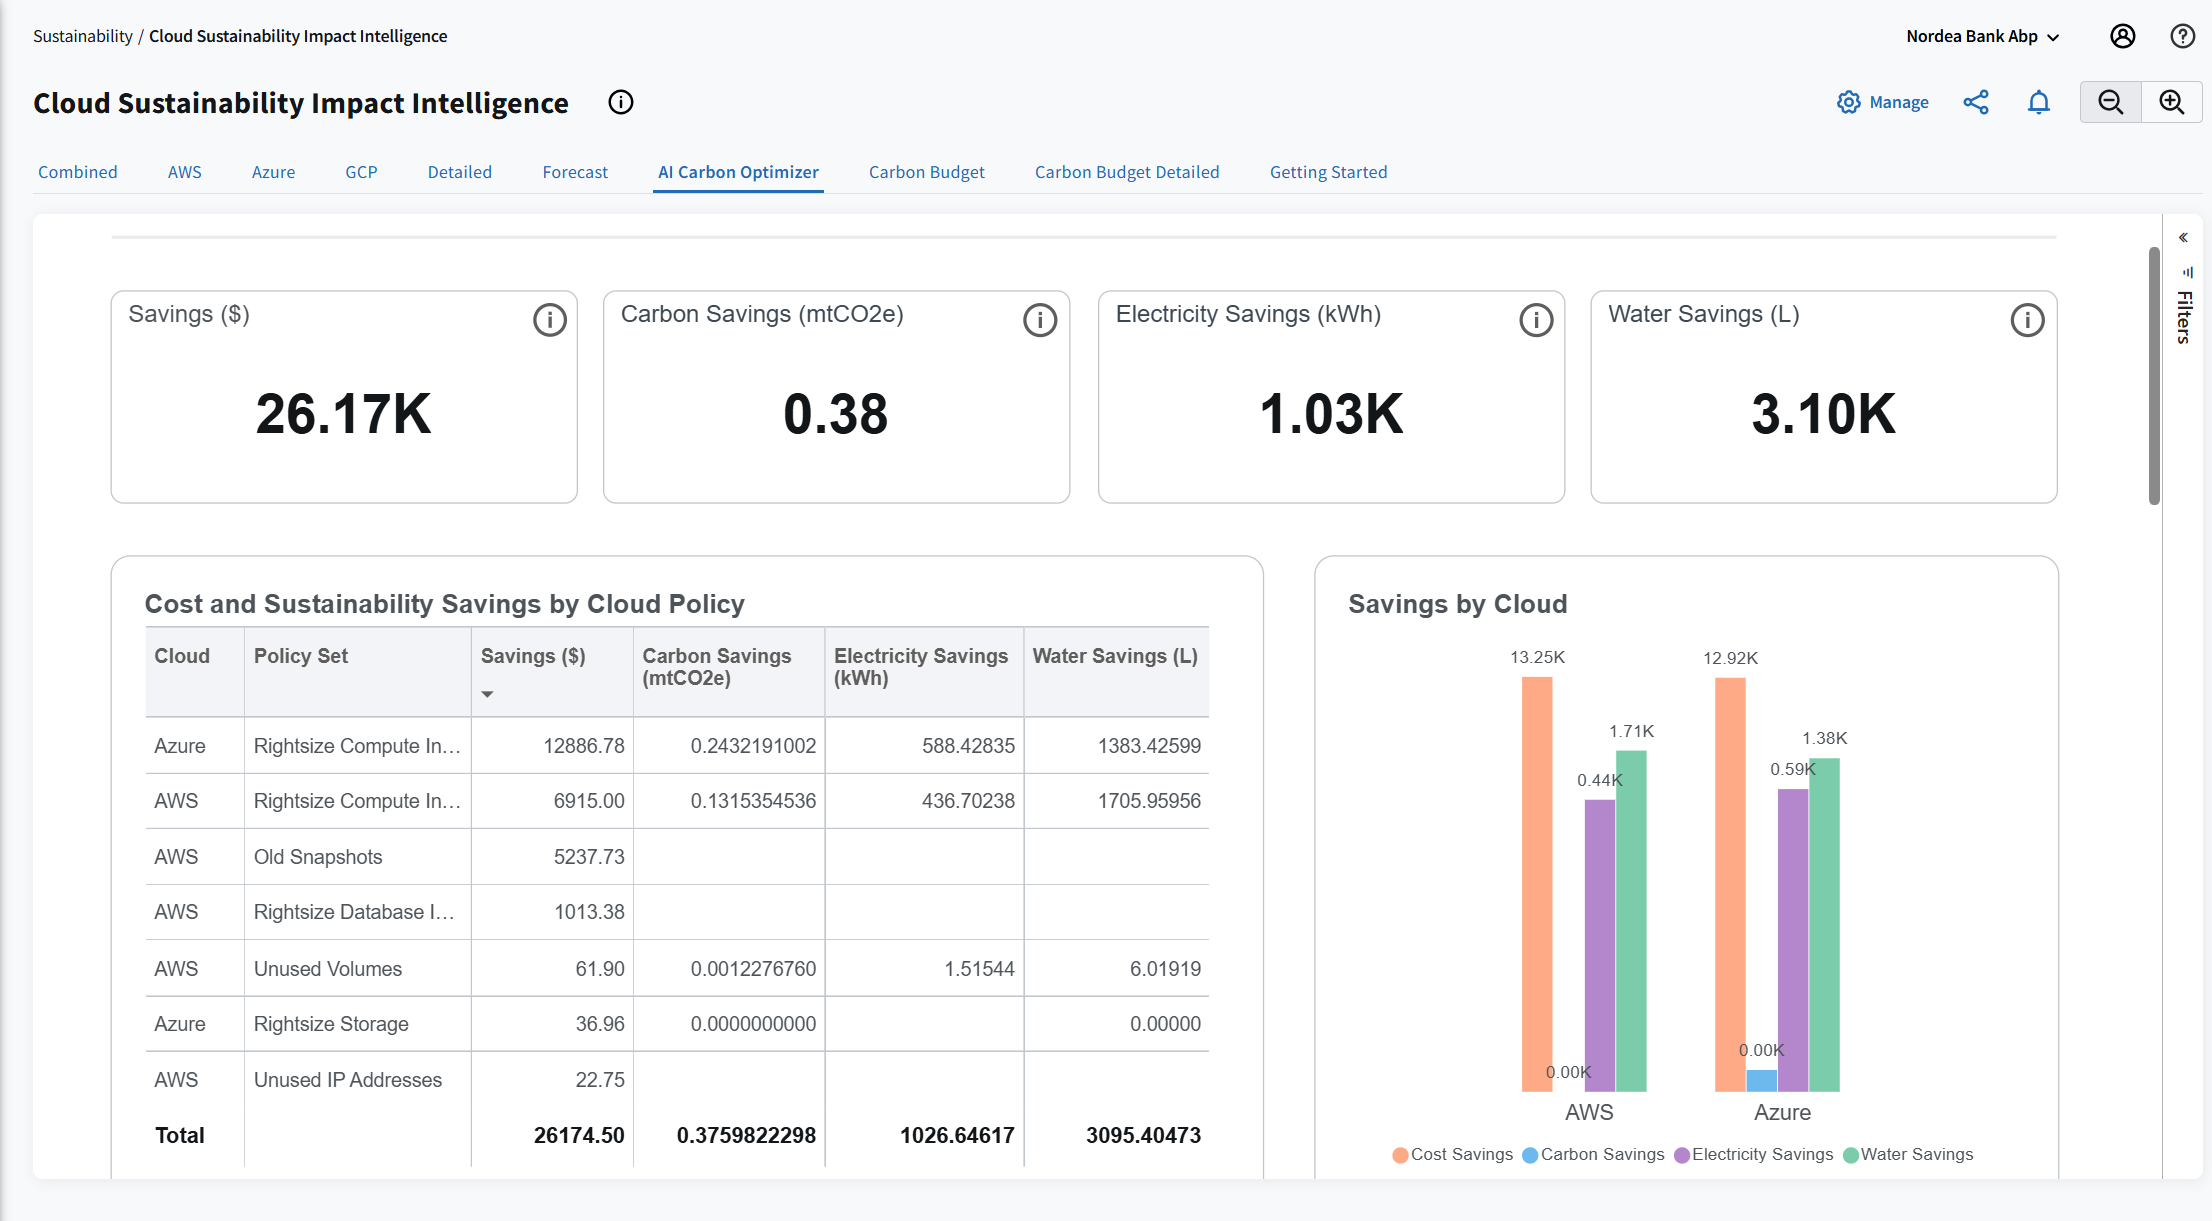
The Carbon Optimizer report from Flexera
For AI workloads, AI Sustainability tracks carbon, electricity, water and spend alongside token consumption, so teams can compare models on more than price. See how it fits into Flexera AI Cost Management.
This applies the discipline FinOps brought to cloud spend to carbon: budget it, track it, reduce it. It’s also a practical foundation for a broader sustainable IT strategy
Our customers’ reaction said it best: once you see the complete story, you can’t unsee it. If you’d like to see yours, let’s talk.
Want to see your complete carbon, water and electricity story? Request a demo using your own cloud data.
Why do cloud emissions reports show different carbon numbers?
Cloud emissions reports often differ because providers and independent data sources use different accounting methods, boundaries and assumptions. Some reports use market-based emissions that account for renewable energy purchases, while others use location-based emissions that reflect the actual electricity grid powering a data center. Differences in scope, timing and inclusion of embodied emissions can also significantly change the reported footprint.
What is included in a complete cloud sustainability assessment?
A complete cloud sustainability assessment includes carbon emissions, electricity consumption and water usage. Looking at all three metrics provides a more accurate view of the environmental impact of cloud workloads and helps organizations understand tradeoffs that may not be visible when measuring carbon alone.
What is the difference between market-based and location-based emissions?
Market-based emissions reflect renewable energy purchases, energy certificates and contractual arrangements made by cloud providers. Location-based emissions reflect the actual carbon intensity of the local power grid supplying energy to the data center. Both perspectives are important because they measure different aspects of environmental impact.
Why is water consumption important in cloud sustainability?
Data centers require water for cooling and electricity generation. As AI and cloud workloads grow, water consumption is becoming an increasingly important sustainability metric, especially in regions experiencing water stress. Measuring water use alongside carbon emissions helps organizations better understand the local environmental impact of their cloud operations.
How does AI affect cloud sustainability?
AI workloads can significantly increase electricity demand, cooling requirements and water consumption. Training and running large AI models often requires substantial computing resources, making it important for organizations to track the carbon, electricity, water and financial impact of AI workloads as adoption grows.
Mark Bradley
Mark Bradley is Senior Product Management Manager at Flexera, specializing in cloud sustainability, IT asset management (ITAM) and product strategy. Mark is a thought leader in sustainable IT and frequently contributes to industry reports and webinars on cloud sustainability initiatives, carbon footprint tracking and the environmental impact of IT operations. His expertise spans product management, hybrid sustainability and the intersection of ITAM and environmental responsibility, helping organizations optimize their cloud infrastructure for both cost and sustainability. Mark’s insights have been featured in the Flexera State of the Cloud Report, Flexera IT Priorities Report and industry white papers, and he frequently collaborates on cross-functional sustainability projects. He is also a co-author of the prestigious Axelos ITIL4 Leader: Digital & IT Strategy book, a testament to his expertise and influence in the industry.