Cloud sustainability
Treat cloud carbon like cloud cost
Real-time visibility into cloud carbon emissions, electricity, and water—at the resource level across AWS, Azure and GCP. Budget it. Track it. Reduce it. The only solution that ties ISO 14064-certified carbon data directly to your FinOps workflows, so sustainability stops being an annual report and starts being a live control.
$5M
Verified customer outcome
(Carrier Corporation, 2025)
800K
Tonnes of CO₂ reduced
by a single Flexera customer
3
Cloud providers
in one unified dashboard
ISO
14064-certified data from
Flexera partner Greenpixie
What it does
The carbon controls your cloud operations demand right now
Apply the same real-time controls you use for cloud cost to cloud carbon emissions. No more annual surprises.
Real-time visibility
Real-time visibility
See every gram across your cloud
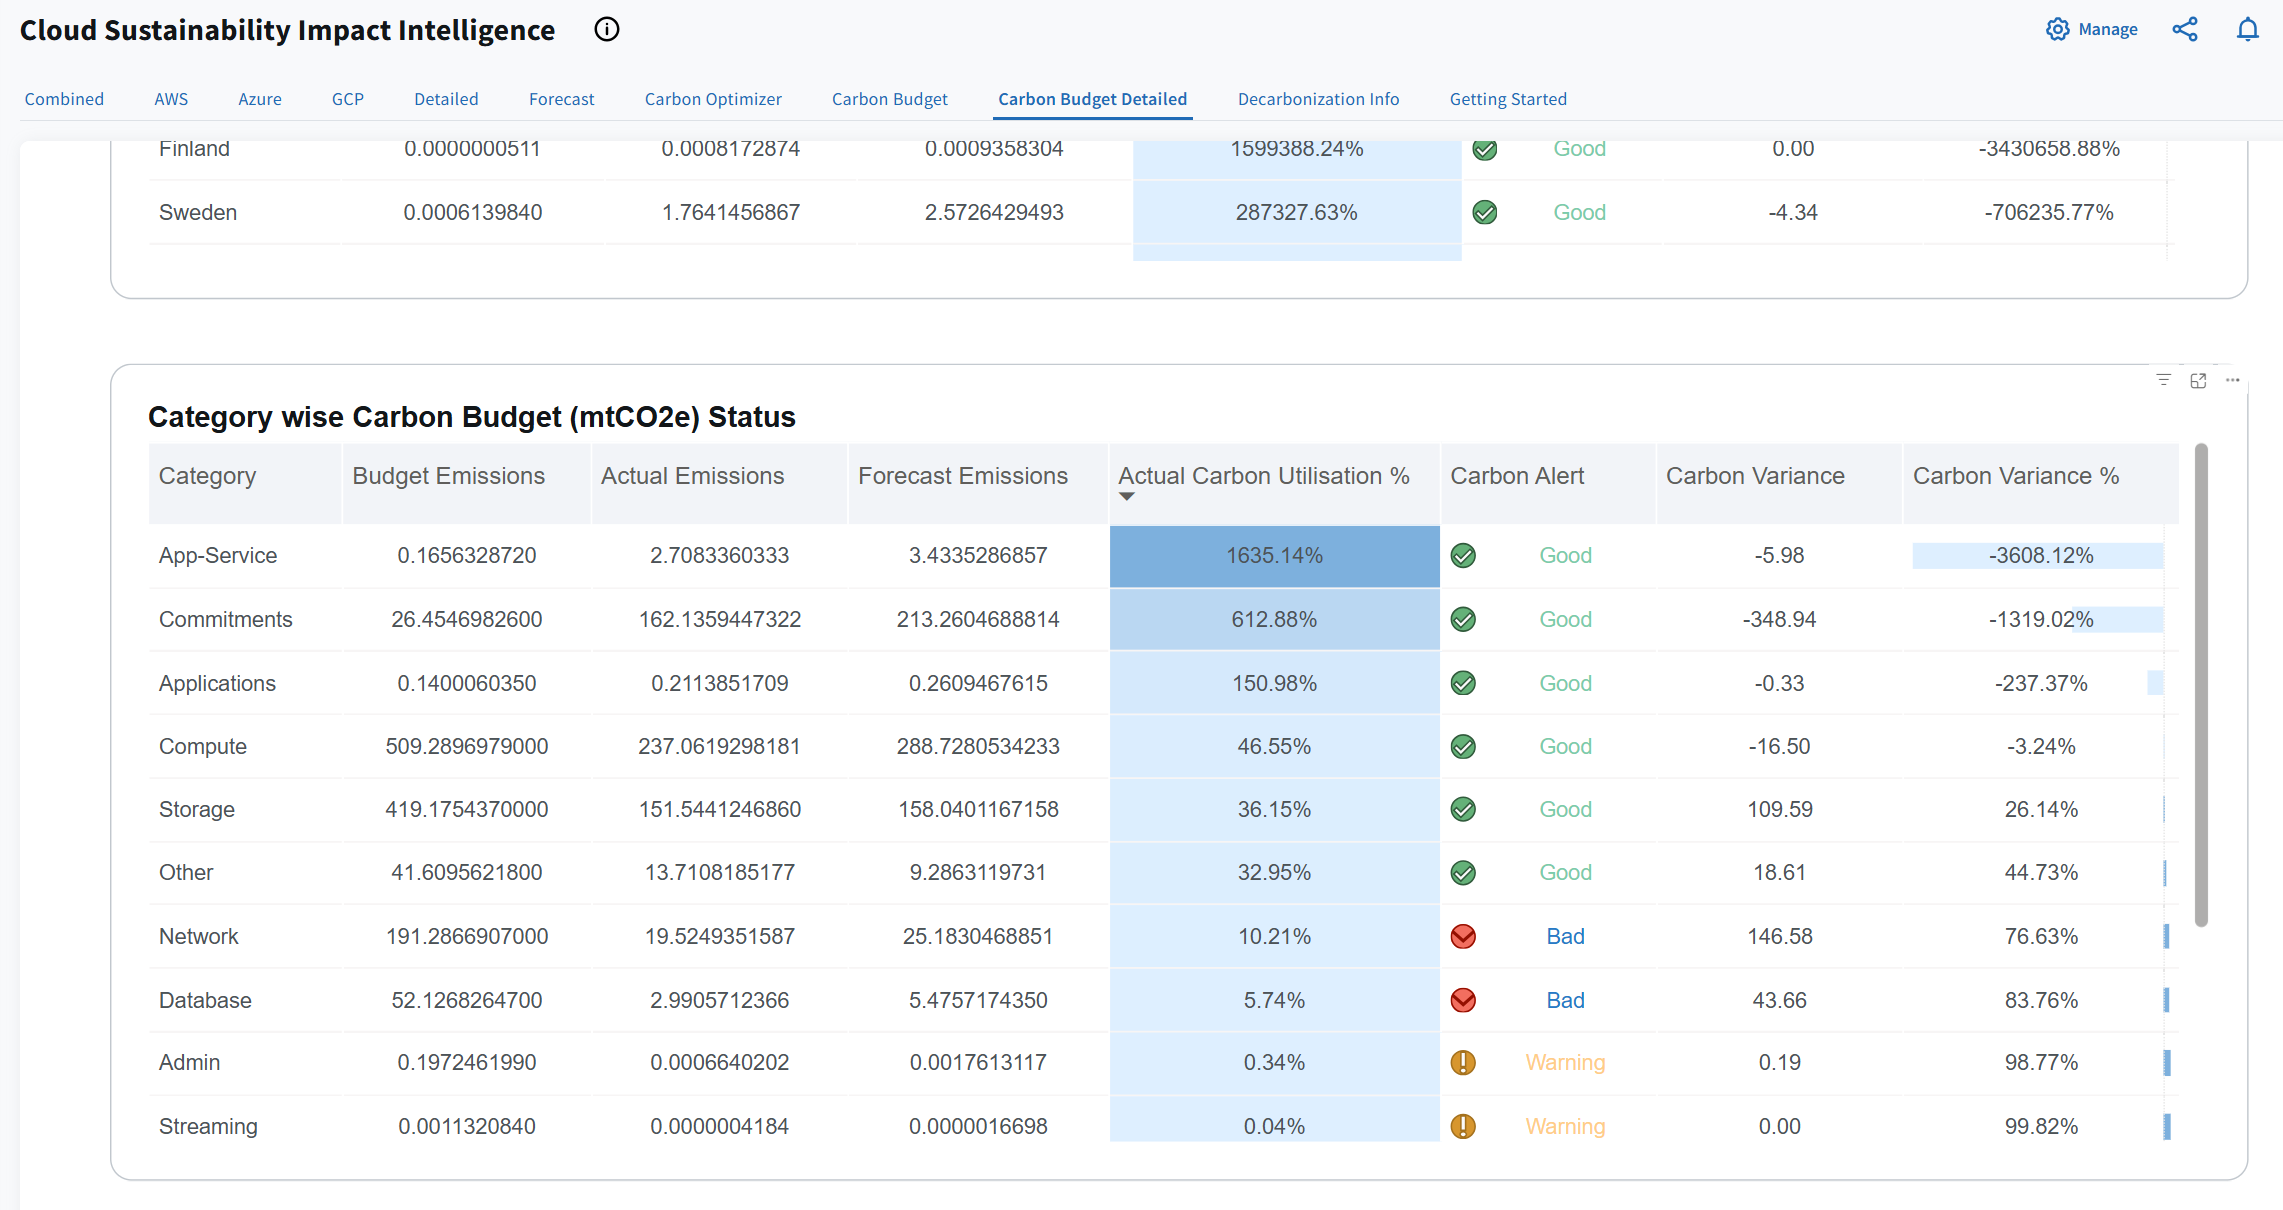
The Impact Intelligence dashboard unifies emissions from AWS, Azure and GCP into a single view. Drill from total cloud emissions to a single resource in seconds. Resource-level CO2e, electricity, and water with 30 tag-based filter dimensions. Powered by Greenpixie—hardware-mapped, not spend-estimated.
Forecast and budget
Forecast and budget
See tomorrow's emissions today
Carbon forecasting applies forward-looking intelligence to your cloud carbon footprint—exactly as FinOps does for cost. Set a carbon budget, track variance in real time and catch overruns before year-end. Twelve-month projection with confidence bounds, real-time alerts and CSRD-aligned reporting output.
Carbon Optimizer
Carbon Optimizer
Cut carbon and cost at once
The Carbon Optimizer surfaces rightsizing recommendations ranked by combined financial and environmental impact. Every recommendation shows CO2e, cost, water and electricity savings—so FinOps and sustainability teams act from the same list. This covers compute, storage, and database across AWS and Azure.
Decarbonization plan
Decarbonization plan
Get immediate, actionable intelligence
- Overall CO2e portfolio grade and clear, region-level detail shows the path to improvement
- Automatic ID of top cloud accounts by CO2e impact and Carbon/Dollar efficiency makes it easy to prioritize
- Actionable insights via data-driven modeling of quantified outcomes, potential savings via rightsizing compute, database, and storage
- Clear guidance for region migrations, from high-carbon regions to low, are backed by Greenpixie-certified carbon intensity data
The Greenpixie Methodology
How we know your carbon numbers are right
Most tools guess. Flexera, powered by Greenpixie, maps emissions from the hardware up — the only approach that produces audit-ready data.
Bottom-up approach
Resource-to-hardware mapping
Every cloud billing line item is mapped to the underlying physical hardware — server type, generation, and utilization — using performance benchmarking data, not estimates.
Oxford University data
Hourly regional carbon intensity
Actual electricity carbon intensity is applied at the region and hour level, using grid data built in partnership with Oxford University. Not the annual averages cloud providers report.
ISO 14064 Certified
ISO 14064-certified output
Greenpixie holds ISO 14064 certification — the international standard for greenhouse gas accounting. Your carbon data meets GHG Protocol requirements and is ready for CSRD reporting.
Why Flexera
Not all carbon data is created equal
End-to-End IT sustainability
Cover your entire IT estate
No other vendor connects cost and carbon across cloud, server, data center, end-user devices and network in a single platform. Flexera IT Visibility–Sustainability adds manufacturer lifecycle carbon data for on-premises hardware, making Flexera the only solution with verified end-to-end IT carbon visibility.
AI Carbon Visibility
See the carbon shadow of AI
Every dollar of AI spend has a carbon shadow, and enterprises can’t see it in cloud provider dashboards. Flexera Cloud Sustainability already covers AI workloads through resource-level cloud data. Ask about extended, dedicated AI carbon visibility at model and token level.
Different models have vastly different energy profiles — larger models like Claude Opus or GPT-4o require significantly more compute than smaller alternatives.
Energy grids differ by region — a data center powered by renewables has a very different carbon footprint than one relying on fossil fuels. If you're not sure, leave it set to Global.
Input Tokens —
Output Tokens —
The GreenOps platform
Carbon treated like cloud cost
GreenOps applies real-time financial rigor to carbon emissions—the same discipline FinOps brought to cloud spend. Set carbon budgets, track variance, receive alerts before targets are missed and report with audit-ready data. One platform. One workflow. Two disciplines finally unified.
Trustable, verifiable, audit-ready.
Flexera gives you the granular, resource-level, ISO-verified data needed to manage CO2e across the entire IT estate.
| Capability | Flexera Cloud Sustainability | AWS / Azure / GCP Native | Sustainability-Only Tools |
|---|---|---|---|
| Resource-level CO₂e (not spend-based) | ✓ | — | Varies |
| ISO 14064-certified methodology | ✓ | — | Some |
| Multi-cloud: AWS + Azure + GCP unified | ✓ | — | ✓ |
| Carbon forecasting & budget management | ✓ | — | Limited |
| Unified cost + carbon in one platform | ✓ | Cost only | — |
| E2E IT estate: cloud + server + devices | ✓ | — | — |
| AI workload carbon (model-level) | ✓ | — | — |
End-to-End IT sustainability
The only platform covering your entire IT estate
No other vendor connects cost and carbon from cloud to server to device to network in a single platform.
Cloud
Resource-level emissions across AWS, Azure, and GCP. Unified dashboard with ISO 14064-certified data from Greenpixie.
Server & data center
Manufacturer lifecycle carbon data for on-premises servers and data center infrastructure via IT Visibility – Sustainability.
End-user devices
Device-level carbon footprint across laptops, desktops, and peripherals — manufacturer-sourced, asset-matched data.
Network
Network infrastructure carbon embedded in the E2E IT Sustainability view — connecting the full scope of your digital operations.
Is your ITAM strategy keeping up with cloud reality?
29%
of cloud spend is still wasted
73%
operating hybrid cloud estates
60%
rely on MSPs in some capacity
Frequently asked questions
Flexera partners with Greenpixie, whose ISO 14064-certified methodology maps every cloud billing line item to the underlying hardware. Hourly, region-specific grid carbon intensity—developed with Oxford University—is applied to calculate resource-level CO2e, electricity and water. This is hardware-up measurement, not spend-based estimation.
AWS, Azure and GCP are supported today in a single unified dashboard. All three clouds appear with consistent, comparable carbon metrics. There’s no stitching together separate provider reports or reconciling different calculation methodologies.
Carbon Forecasting projects the next twelve months of emissions from historical actuals, applies confidence bounds and tracks variance against a carbon budget in real time. You receive alerts before targets are missed—not an annual audit of overruns you can no longer fix.
It replaces the gaps in it. Provider tools deliver spend-based estimates scoped to their cloud only. Flexera delivers resource-level, ISO-certified data across all three clouds, connected to your FinOps workflows and your full IT estate—including on-premises servers and end-user devices.
Yes. Cloud Sustainability is an add-on to Flexera One CCO, activated via standard workflow within 48 hours. If you're already a CCO customer, you can be live with resource-level carbon visibility in under two business days.
Everything you need to understand, evaluate, and activate Cloud Sustainability.
Resources
Ready to make carbon a first-class metric?
See how Cloud Sustainability connects to your existing Flexera One environment—and start treating carbon like cash.