Application Rationalization
Streamline your IT landscape: Reduce costs and complexity with application rationalization
Is your application portfolio bloated, costly and difficult to manage? Application sprawl, driven by decentralized purchasing, M&A activity and technical debt increases costs and security risks. Flexera provides the automated inventory, enriched data and usage insights you need to confidently rationalize your application portfolio, eliminating redundancies and maximizing business value.
Complete, reliable data to reduce sprawl
HYBRID IT APPLICATION INVENTORY
HYBRID IT APPLICATION INVENTORY
Inventory and usage data for all apps
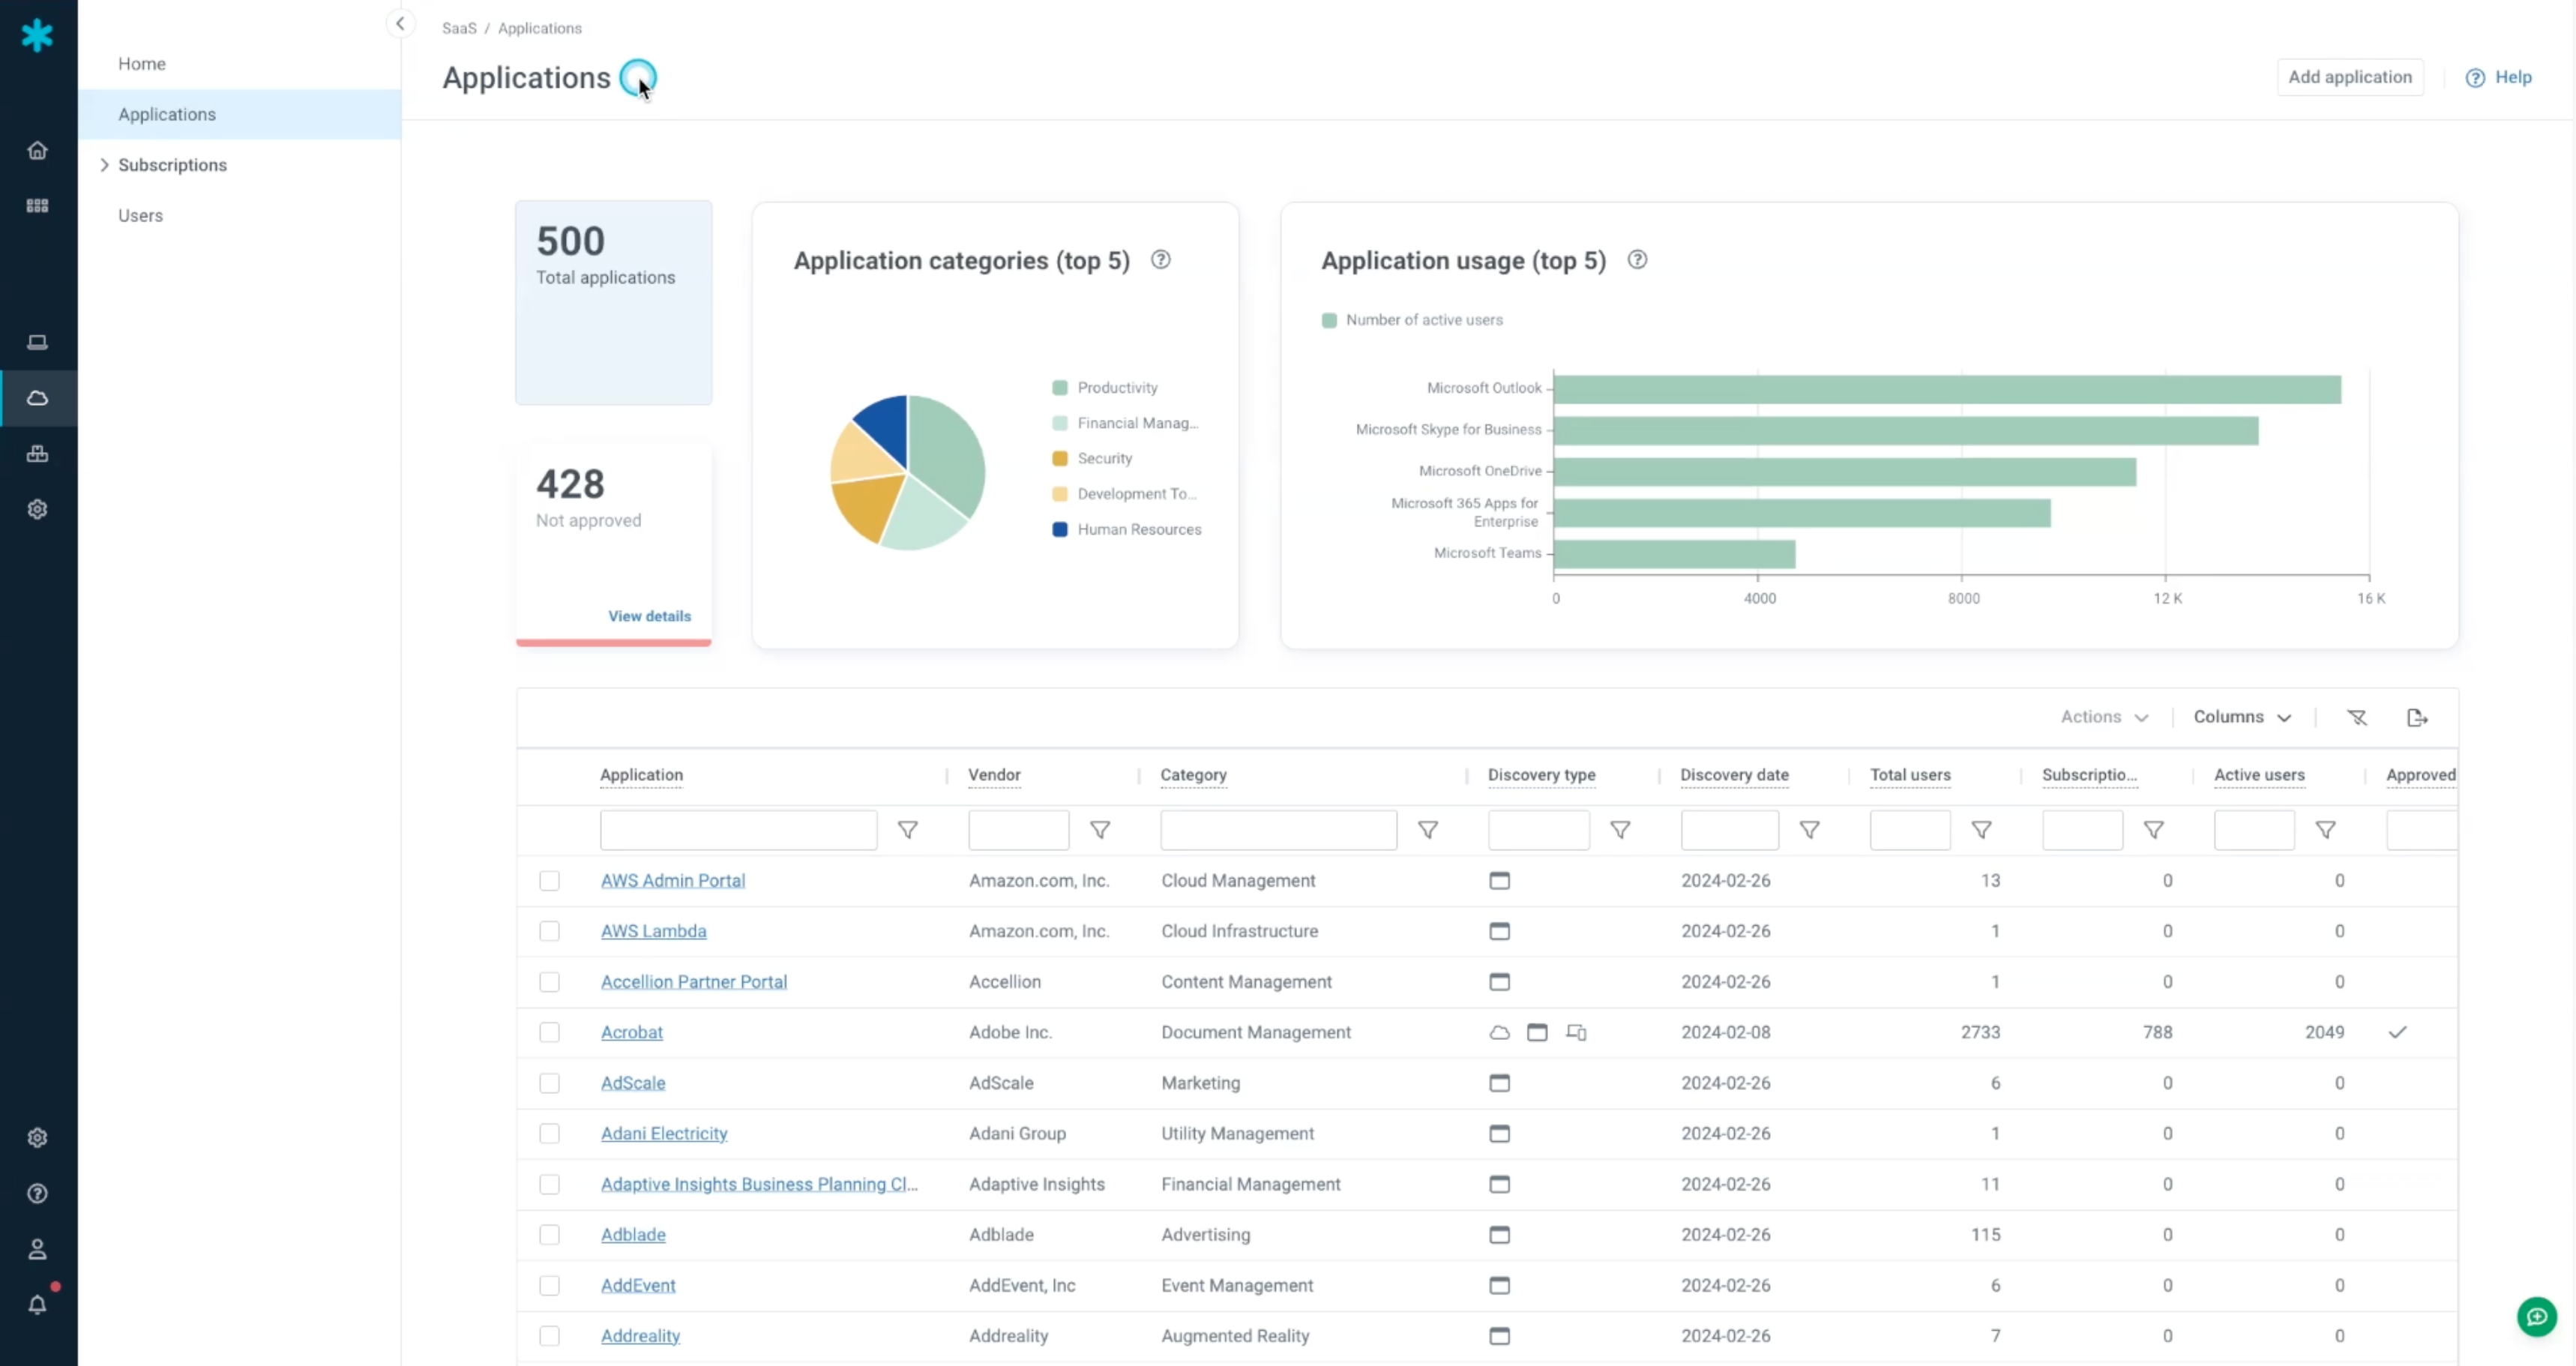
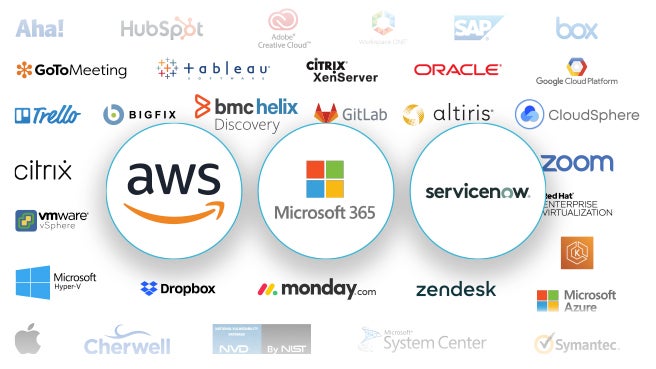
Without leveraging multiple discovery sources, it is impossible to get a complete view of your entire application catalog across on-premises and SaaS environments. To reduce application sprawl, the first step is understanding all the applications you’ve paid for and how these applications are being used. Flexera provides multiple discovery methods to help you get a complete inventory across your on-premises, SaaS and cloud application environments.
APPLICATION NORMALIZATION AND ENRICHMENT
APPLICATION NORMALIZATION AND ENRICHMENT
Rationalize app use with clean and enriched data
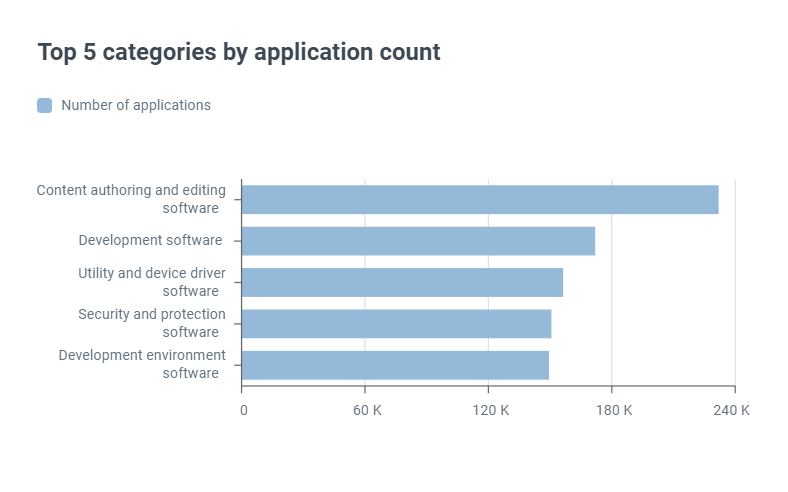
Cleaning and updating application data using spreadsheets is a headache and never-ending task. Flexera automatically normalizes and enriches IT application data with application categories and other details to easily identify application redundancies and minimize risk from outdated versions in use.
USAGE AND COST INSIGHTS
USAGE AND COST INSIGHTS
Find app waste with usage insights
According to the Flexera IT Priorities Report, the top three priorities for IT leaders are integrating AI, reducing costs and mitigating risk. To help achieve these goals, compare common application usage and costs to determine which applications should stay, which should go and if enterprise agreements should be consolidated for better terms and volume discounts.
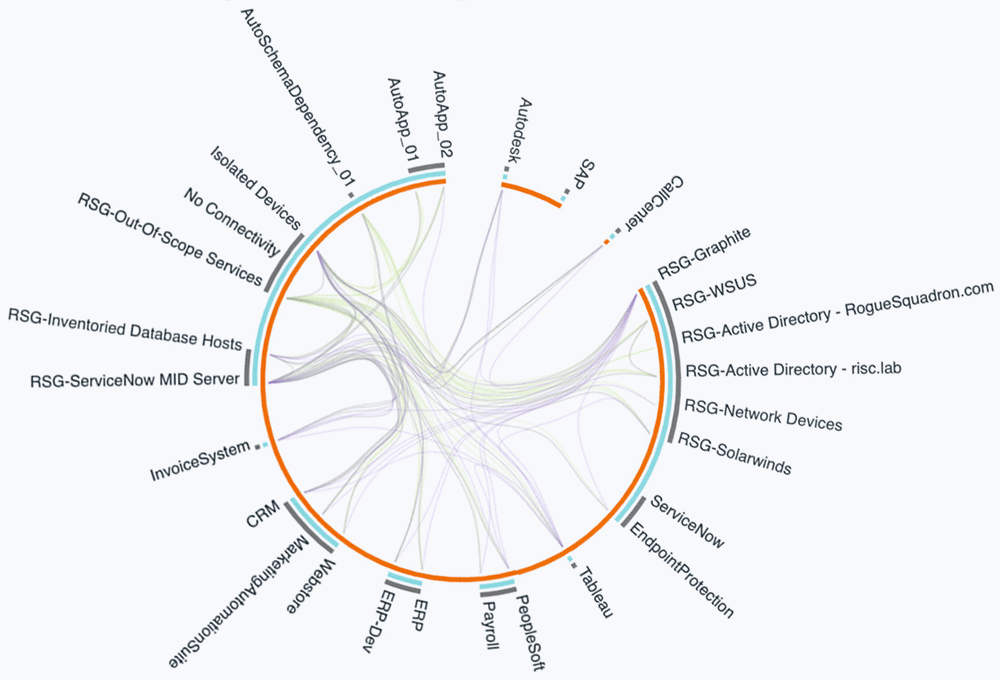
BUSINESS SERVICE CONTEXT
BUSINESS SERVICE CONTEXT
Eliminate tech debt with context
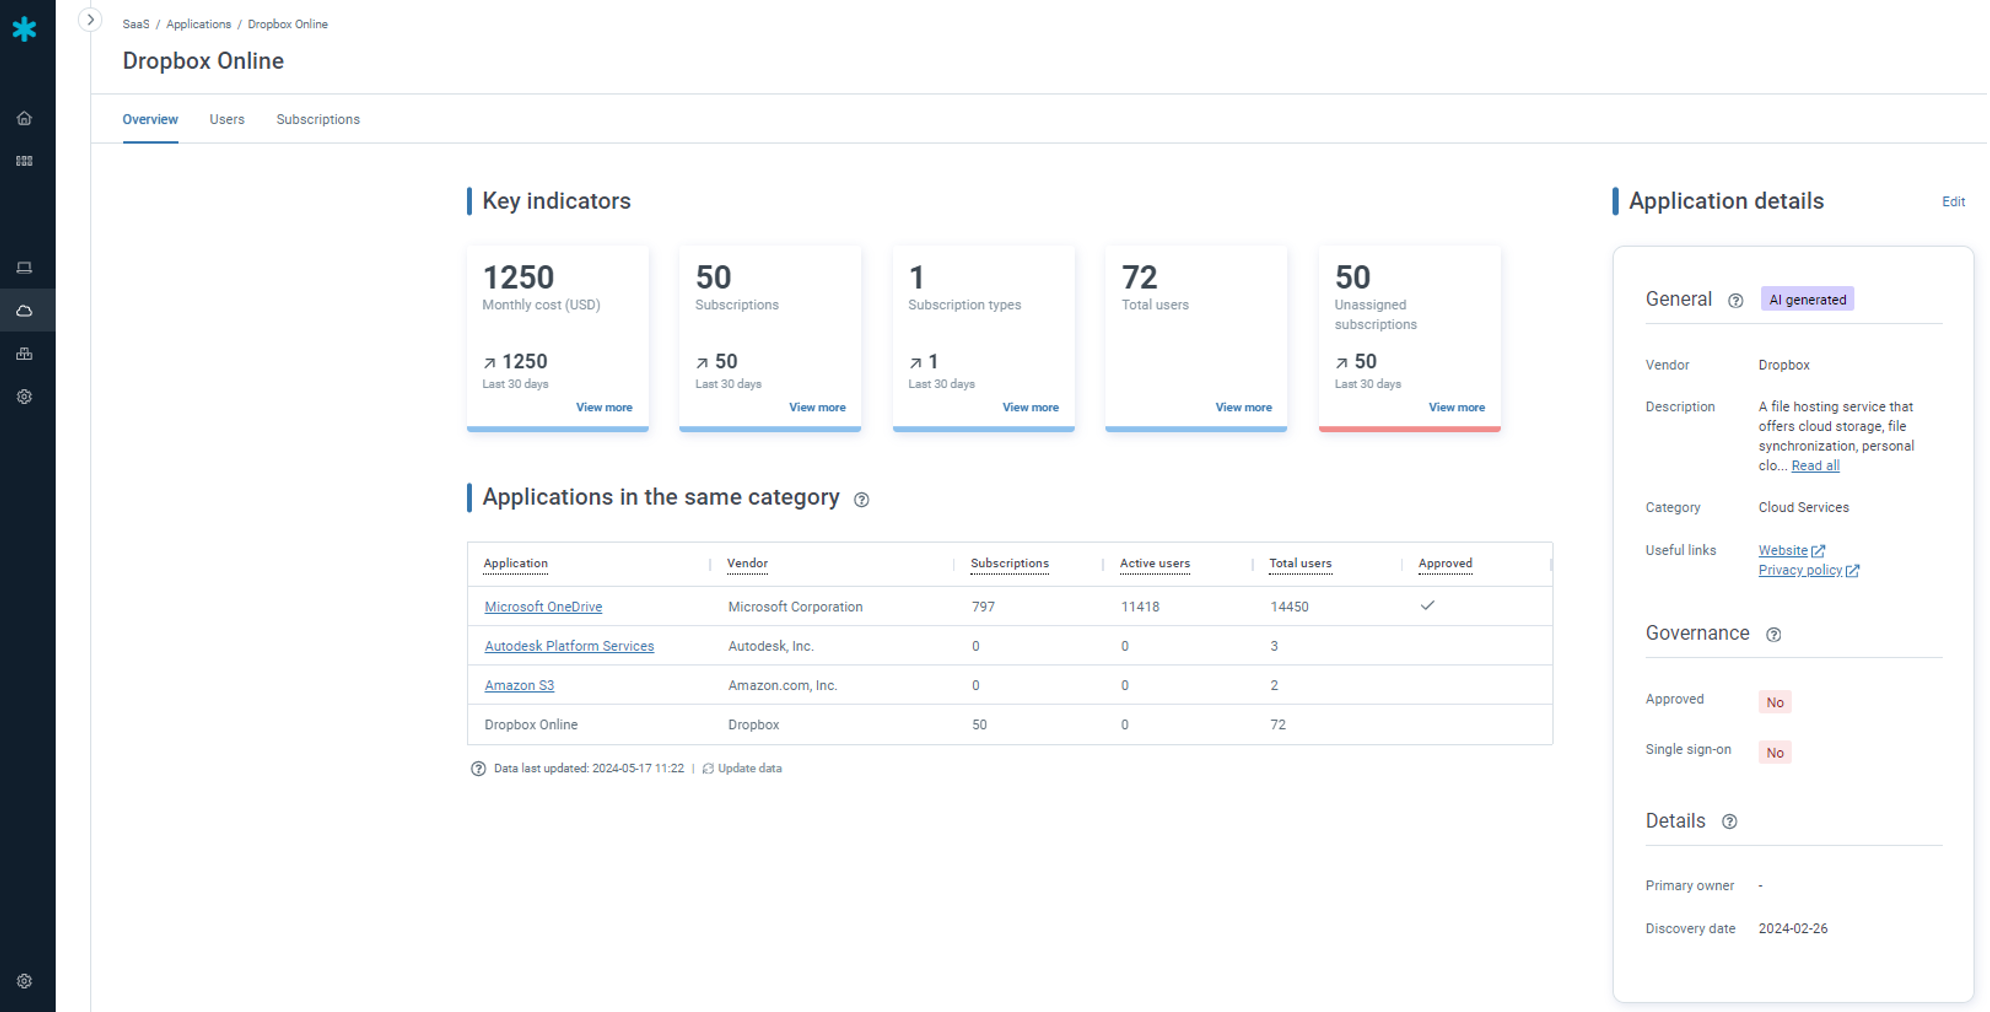
To remove time and resource barriers for integrating AI, reduce technical debt brought on by application sprawl. To effectively make application rationalization decisions, you need clear visibility of application dependencies. Flexera helps you understand where your applications tie into existing business infrastructure and power organizational initiatives.
CLEAN AND ENRICHED DATA
CLEAN AND ENRICHED DATA
More data insights for strategic IT
Flexera combines the industry’s most extensive catalog of technology data and software use rights with multi-source asset discovery data to deliver comprehensive IT visibility. Our 98%+ normalization rates are best-in-class and give you a continuous pipeline of clean and consistent data so that you can improve your CMDB, ITSM, security, and enterprise architecture tools.

The hidden drain
How application redundancy impacts your business
Over time, organizations accumulate a vast number of applications, many of which are redundant, underutilized or no longer aligned with business needs. This application sprawl creates significant technical debt, drives up licensing and maintenance costs and increases your security attack surface.
- Inflated software costs: Paying for multiple applications that perform the same function
- Increased security and compliance risk: Maintaining outdated, unsupported, or unpatched applications exposes you to vulnerabilities and audit penalties
- Operational inefficiency: Supporting a complex, bloated application portfolio drains valuable IT resources
- Poor user experience: Employees face confusion with multiple overlapping tools, hindering productivity
- Inhibited agility and innovation: Technical debt from a complex application landscape slows down digital transformation and cloud migration initiatives
- Complete hybrid IT inventory: Discover all applications across your estate, from on-premises and datacenter to SaaS and cloud marketplaces
- Automated normalization and categorization: Automatically cleanse inventory data and assign functional categories to easily identify redundant applications
- Clear usage and cost insights: Understand which applications are actually being used and their associated costs to assess true business value
- Business service context: Map application dependencies to understand their role in powering critical business services before decommissioning
- Informed decision-making: Use a complete, reliable dataset to confidently decide which applications to invest in, maintain or retire
Achieve clarity
Achieve clarity and efficiency through data-driven rationalization
True application rationalization requires a complete and reliable view of your IT estate. Flexera provides a single source of truth by automatically discovering, normalizing and enriching your application data. This empowers you to make informed decisions to retain, replace, retire or consolidate applications across your entire hybrid environment.
A proven framework for success
The 4 R's of rationalization
A structured approach is key to successful application rationalization. Flexera solutions support the industry-standard framework to help you methodically assess your portfolio.
- Re-host (relocate): Moving applications to a different infrastructure (e.g., cloud migration) without significant modification
- Re-platform (revise): Making some modifications to an application to better leverage a new platform
- Retire (remove): Decommissioning applications that are redundant, have low usage or provide little business value
- Retain (keep): Continuing to support and maintain applications that are cost-effective and critical to the business
- Accelerated digital transformation: Reducing technical debt and complexity makes it easier to adopt new technologies and migrate to the cloud
- Significant cost savings: Lowering expenses on software licensing, maintenance and support for redundant applications
- Reduced security and compliance risk: Eliminating unsupported and vulnerable applications from your environment
- Increased IT and business agility: A streamlined portfolio allows for faster response to changing business needs
- Improved productivity: Providing employees with a standardized, curated set of best-in-class applications
More than a cleanup
The strategic benefits of a lean application portfolio
Application rationalization delivers more than just immediate cost savings. It creates a more agile, secure and efficient IT environment that is better positioned to support business growth and innovation.
The Flexera advantage
Unmatched technology intelligence
Flexera’s technology intelligence portfolio provides the most comprehensive and reliable data in the industry, giving you the foundation needed for successful application rationalization.
The power of clean data |
Actionable, contextual insights |
| Technopedia™: Leverage the world’s largest IT data library for over 98% application recognition and normalization rates. | Usage metering: Understand which applications are actually being used, and by whom, to assess their value. |
| Automated categorization: Automatically assign categories to applications, making it easy to spot redundancies. | Dependency mapping: Gain visibility into application dependencies to avoid disruption when decommissioning software. |
| Hybrid IT discovery: Get a complete inventory of applications across on-premises, SaaS and cloud. | AI-powered insights: Leverage AI to accelerate data enrichment and the identification of rationalization candidates. |
With Flexera, you can move beyond manual spreadsheets and gain the automated, data-driven intelligence to continuously manage and rationalize your application portfolio.
Real-world impact
How Investec mitigated risk with Flexera
Using data from Snow Atlas to complement the view of our SaaS sprawl helped us to mitigate our threat exposure.
Frequently asked questions
Your application rationalization questions answered
The primary goal is to create a more efficient, cost-effective and secure application portfolio by identifying and eliminating redundant, underutilized or low-value applications.
Flexera uses a combination of comprehensive inventory, automated software normalization and functional categorization (powered by Technopedia and AI) to group similar applications, making it easy to spot overlaps and redundancies.
Decisions are based on a combination of factors, including business value, functionality, user preference, cost and alignment with enterprise architecture standards. Flexera provides the usage and cost data needed to make these informed decisions.
Technical debt is the implied cost of rework caused by choosing an easy solution now instead of using a better approach that would take longer. Application rationalization reduces technical debt by eliminating outdated, legacy and unsupported applications that are costly and difficult to maintain.
Yes. Flexera provides visibility across your entire hybrid IT estate, enabling you to rationalize both traditional on-premises software and your growing portfolio of SaaS applications.
Industry insights to help keep you informed
Informing IT, Transforming IT

