Webinar
When every query has a price tag: Take control of your Snowflake spend
Related Solutions
Overview
In this 30-minute on-demand webinar, Uncover the causes of rising Snowflake costs and the best ways to optimise them.
Snowflake has changed the way organisations store and analyse data—but as usage grows, costs can rise quickly and unpredictably. Many teams find it difficult to see what is driving their Snowflake spend, who is accountable for it, and where the biggest opportunities to reduce waste sit. Without clear visibility, cost surprises become the norm rather than the exception.
Join Flexera experts, Nathan Stevens and Ravi Pankhania for a practical session on how to take control of Snowflake costs—covering the drivers behind spend, the most common optimization opportunities, and how to build stronger accountability across your data platform environment.
Why attend
Snowflake costs rarely spiral because of one big issue—they grow through thousands of smaller decisions around compute, storage, and query patterns. Without the right visibility, most organisations only spot inefficiencies once the invoice lands.
In this session, you'll learn how leading organisations are gaining control of their Snowflake spend, improving accountability, and ensuring every dollar invested in their data platform delivers real business value.
This session is ideal for leaders and teams responsible for:
FinOps practitioners
Cloud and data platform leaders
Data engineering and analytics teams
Cloud architects
IT finance and cost management professionals
Key takeaways
- The main drivers of Snowflake costs, including warehouses, storage, and data movement
- Where the biggest optimization opportunities exist and how to prioritize them
- How to allocate Snowflake costs accurately across teams, projects, and business units
- How to improve accountability through chargeback and showback
- A live demonstration of Snowflake cost optimization in Flexera One
- Practical, high-impact actions you can apply straight away
Speakers

Nathan Stevens
Senior Director, Solutions Engineering (APAC)
Flexera

Ravi Pankhania
Solutions Architect (EMEA)
Flexera
Snowflake cost optimization insights
- The main drivers of Snowflake costs, including warehouses, storage, and data movement
- Where the biggest optimization opportunities exist and how to prioritize them
- How to allocate Snowflake costs accurately across teams, projects, and business units
- How to improve accountability through chargeback and showback
- A live demonstration of Snowflake cost optimization in Flexera One
- Practical, high-impact actions you can apply straight awa
Listen now to uncover the causes of rising Snowflake costs and the best ways to optimize them
Transcript
Nathan Stevens 00:19 - 02:20
Alright. So welcome, everyone, that's just joining us today.
I'll give everyone a few seconds to get into the platform, navigate Goldcast, so everyone can join us today. So I'll give it a few more seconds.
I can see some people streaming in at the moment, so that's good. Looks like the link is actually working today.
So, alrighty, I think we've got, most people in that are joining us. So for those that have just joined us today, thank you for joining the webinar series once again.
Today is all about Snowflake. So how to take control of your Snowflake spend.
So, we put this tagline on when every query has a price tag. So anything we do is consumption based.
Every query, every workspace has a cost associated with that. So today, I'm joined by Ravi.
He's one of our, SMEs in this space. So one of our solution architects is joining us to talk us through some of the details about what Flexera can do to help you with your Snowflake spend.
Now for those that may have just joined us for the first time or you've been through a few of these, we do have a series that we've actually published now on YouTube. The link is here.
We'll post it in the chat as well. So for those that are interested in catching up on some of the great topics that we've had over the last about year and a half now, everything from FinOps to data cloud or Databricks previously, SaaS management, ITM sustainability, you name it.
We've covered it in the last eighteen months. So click the link, and engage the content.
Let us know what you think. So for today, we're going to focus, on Snowflake, how do those Snowflake costs spiral and what are the stakeholders personas that are driving that as well, how to really understand the cost associated with Snowflake.
So feel free today. If you've got questions, put them in the q and a section of the chat here.
We'll monitor that throughout the session today. We'll try to get to them throughout, and talk to you throughout the session or at.
Nathan Stevens 02:20 - 09:31
the end. And if we don't get to them, we'll be sure to reach out to you and try to, you know, answer your chats offline. Next month in October, we're going to go through the engineer behind your next cloud savings isn't human.
So this is where we start to really look at our ocean capability and the autonomous workload optimization. So here, we're looking at containers, particularly around the Kubernetes stack, looking at how we actually go through and do rightsizing and spot instance management.
Really looking at how to save cost associated with, that space, but also as well as how do we automate a lot of those practices that, you yeah, we should be able to automate, in this day and age. Come to November, we're going to take a bit of a deeper dive into rate optimization.
So get rid of the spreadsheets. No need to do the number crunching on the spreadsheet there.
So we're gonna get you savings within the platform using our AI and our algorithms to divide seller's commitments. It'll drive, any the cost down associated with those commitments that you already own.
So it's a great, been off focused journey over the next three months. Alright.
So just starting off, as always, I like to put a bit more about what the market is doing, and this is a refreshed slide from what I've previously shown here. But the key thing for us is that over the next three years and so we've already had this massive jump, you know, over 50%, and I think it's around 67% jump in spend in cloud.
We're going to see a 91% increase in spend over the next three years. So this is another Gartner prediction, and it's primarily driven from the explosion of AI optimized infrastructure.
So you can see down in the second line here, a 187% increase. We start to look at the GPUs, you know, high speed networking, especially data storage.
So that's what's driving a lot of these costs up again. It never goes down.
It always seems to go up year on year. Finally, in 2029, $500,000,000,000 cloud spend.
Now and the data cloud and the topic today really drives and underpins that. Now as we start to look at, you know, Snowflake, and where that's positioned within our FinOps, capability, now we look at data cloud optimization.
And I love this slide. It really does show the complexity around the FinOps space.
You know, FinOps is not just cloud cost optimization or ingesting billing and understanding your bill and getting a few recommendations anymore. It's much more broader than that.
Now even the FinOps foundation has broadened their scopes to include things like SaaS and licensing and AI, This is representative of that. So we start to look at data cloud optimization today.
In the next two months, we tackle the top two sort of buckets here, workflow optimization, and rate optimization. So fantastic.
Now if you really wanna look at tackling FinOps in a complete package, this is the way to do it with all of the building blocks you see on the screen in front of you. Alright.
So data files. You know, why data clouds are now a FinOps priority? So what we're really seeing is actually the transformation in this space has been huge.
So when we started to look at, you know, the research back in March this year, looked at, you know, how the landscape has changed. It's really about in '25, there was maybe 10 or 15 platforms.
Now we've had this explosion this year. We're doubling that number, and it's probably more even now as we go into the latter part of the year.
But that's really driven from three things. You know? We've moved from on premise, warehouse style architecture into sort of lakehouse architectures native in the cloud.
And there's a demand in the market for real time analytics engines. And then we also look at the AI native data platforms, like Pinecone and LensDB and others that are really driving the adoption of having to store data in a data cloud and on the foundation, you know, whether that's like the Databricks and Snowflake.
Now we're focusing on Databricks and Snowflake for one good reason is they take up most of the market share out there today. So we start to look at 50% of the market share of Databricks that alone.
You got the outliers there with the, foundries, the BigQuery, Amazon as well have Redshift. There's a few other different platforms in there, but the two main areas of focus, Databricks and Snowflake, and that's the problems we're looking to solve for.
In fact, when we look at the broader market, including the hyperscalers, the combination of Snowflake, Databricks, and those hyperscalers make up 90% of that data platform momentum. These are the go to within the market today.
Now the industry is the same exactly the same thing. You know, when we start to look at the state of FinOps reports, over the last year, and this is a report that you can download from Flexera.
But data warehouses are the number one most commonly adopted service outside of core compute. So you can see on the screen, it might be a little bit small, but this is at the top of that pile of that list.
Now AI is in the is in the mix there somewhere as well, maybe even overtaking it, but AI is also contributing to the adoption of the need for these data warehouses. In the middle, firmly here is the FinOps priority.
Now between those that are man managing it today or planning to manage, the data cloud data warehouse in the next twelve months makes up close to 80% of the people that responded to, the state of FinOps report. Those driving the need, as as commonplace these days as these are AWS's and GCP.
However, when it starts to look at data cloud and why there's some unique challenges around that, say, compared to public cloud, we start to look at things like shared resources, which generates low visibility. We don't really get an understanding about the granular split between teams and functions and projects, and it makes it very difficult to understand who's consuming what within these environments.
There's also a concern about variable spend or obscure pricing. So when we start to look at consumption base, you really find it difficult to actually understand what you're using, how you're using that, and especially with the credits model that we're looking at in Snowflake.
It it it it ups obfuscates the cost levers here, whether it's a storage, a network, or the consumption on the, front end on the serverless layer. But you don't really get to see what's contributing to that.
So, you know, you just get the credits and get charged for those. In that as well, it makes it hard to forecast.
So how do I know I'm going to spend the next month within the next six to twelve months? So trying to do this manually is very difficult. So, usually, what will happen is, you know, the developers, the data card engineers out there will over provision what they need just to be safe.
So speaking of those people, Ravi is now just gonna take us through what are the personas that make up this option.
Ravi Pankhania 09:31 - 17:10
Thank you, Nathan. Yeah.
So let let's talk about the Flexera One platform as a whole. Alright? Let's take a step back and look at the macro.
The reason why Flexera is so uniquely well placed to kind of address a lot of these, kind of personas is because the way that the company is kind of being built up is saying, well, okay. You know, one person isn't just accountable for one specific area.
It seems like, you know and this is very much in line with the finance foundation. It's about breaking down those silos, shared accountability, teams work working across functions.
And so this is essentially what Flexera has been doing over the last few years. Now when we come to Snowflake, this has been a relatively new newer, initiative for us.
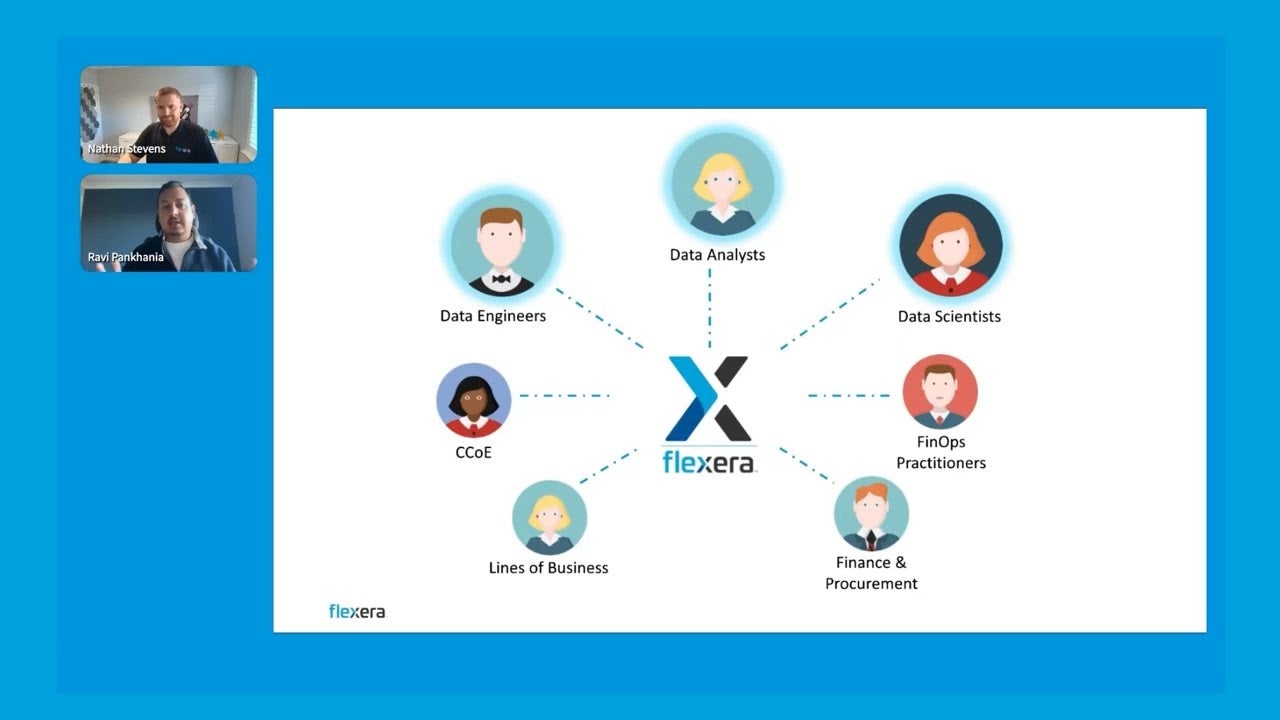
So we did an acquisition earlier this year, and we're bringing additional, personas into the fold here. So the people that are kind of used to anyway are FinOps practitioners, finance procurement, clients of business, CTOE, as well as our ITAM side of things, so Sam, Ham, percentage as well.
And now we're bringing in the data ops teams. So we're talking around data engineers, data analysts, as well as data scientists.
So the idea here is for everybody to come together on the platform and start to collaborate. Okay? Because this is where, you know, what Nathan mentioned is a lot of this spend has started to really explode in the last couple of years.
The industry is looking at making sure we start to have a a good grapple on this. And so when that happens, we all kind of need to work together and make sure we're collaborating, on the on the on the on the on the macro scale in that sense.
So, as we move to the next slide, the way that we're starting to see this kind of fan out is we're pulling the data scientists and data analysts into the picture, but we still need a enough practitioner as part of that conversation to start to have a heavy collaboration between the two. And the reason why we're starting to see that is because, you know, on the data scientist side, on the Snowflake side, Databricks side, whatever that may be, the data cloud side, there's a lot of expertise around the technicals, around the designs of the pipelines, and, you know, the priorities are very different.
Right? And we're trying to make sure that we start to align our priorities. So for the people on the left, the AC engineers, their priorities are SLAs, designing things, security, and making sure things like your query time and concurrency around the warehouses is all is all good and well designed.
And for the finance practitioners, what we're talking about here is understanding what our costs are, how can we optimize, where can we have that level of governance, and then making sure that everything is secure in one single area. So there's really a strong bidirectional, conversation that needs to be happened where you're really gonna start to see that, I guess, a lot of the benefits of making sure you do have those conversations.
And so that's where, essentially, what Flexera here, is enabling you to do. Right? And that's what our platform is here to do.
So as we go to the next slide, the reason why this isn't just a one man band, problem is because, you know, when we look at Snowflake and we say, well, okay. This is, you know, in the cloud, it doesn't mean necessarily that the pricing structure and the pricing dimensions are gonna be the same as what we traditionally call in the cloud with the hyperscale, so AWS, GCP, and Google.
So with those, you know, you're talking about, you know, instance sizes as well as different commitment levels and savings plans and things of that nature. But now when we talk around the data clouds, data cloud platforms, those dimensions are vastly different and actually get a lot more granular, and very much more technical.
So this is essentially, and it looks quite a busy slide, quite an ugly slide, but that's kind of the whole point of it, is to basically identify that, hey. This is a complex problem purely because just one aspect of this in terms of the pricing, there's just so many multiple variations of this varying by pricing meter, by the addition that you have, the commercial rate, and then down to the SKUs.
And then depending on, you know, what the engineers are sizing up within the environment and then what additional capabilities that we want. So we're not just talking about usage metrics here and dynamic usage metrics.
We're talking about additional capabilities, how they're being used, how long they're being run, and things of that nature. So as we go to the next slide, it really encompasses the overall complexity.
Right? So I was focusing on pricing. Now this is everything all in one bucket.
Again, relatively busy side, but I think it kind of gets across the point. So Snowflake spend is very, very dynamic.
It's consistently changing, not just based on pricing, but pays, based on your clusters, based on your queries, based on all these different aspects that really need to be calculated. And that's a tough job to do.
Right? So we're making sure that we kind of start to have that collaboration with the FinOps teams and the DataOps teams and come to a central point where you're able to then say, okay. This is what we've got within the environment.
Then how do we move to the next stage of, for instance, optimizing and then governing the environment as we go forward? Okay? So that's kind of making sure we outline the challenges that we currently have today. So as we move to the next slide, we're kinda I'm gonna show you a little bit around the, capabilities that we currently have within Flexera to help you address those challenges.
So there's a number of boxes from left to right, brand new cost reporting, and so on and so forth. I'm gonna go through some of these, areas within the, within the demo, near the end of this session.
So just to kind of briefly walk through these capabilities, I think one of the fundamental things is visibility. Right? Visibility at the top level, visibility at the business level, and then granular visibility as you go down.
Like I mentioned, the the system is designed to have multiple different personas, so we wanna make sure that we're giving the right level of, you know, dashboards or that level of visibility and information to the correct people where they can impact it. Okay? So that's one of the major aspects of this.
Once you've got that sorted and once that's, you know, you're on top of that, that's where you can start to move to the next stage, which is cost allocation and chargeback. Right? We all know that teams multiple teams may work on multiple different projects.
And, again, that brings in another level of complexity while we're trying to understand who's accountable for spend, and how can we curve spending as well. And so, really, if we're able to then have visibility of what spend is going on, then we can start to have a look at, okay, how do we allocate this spend out to the correct teams and have a view or at least a benchmark between the different teams to make sure we know how much they're spending according to the project that they currently have.
Right? And then once you've got that, then you can have a look at your forward guidance. Right? As a business, I always wanna think about what am I doing to the next quarter? What am I doing in the next half and the next year to help me budget that out? So then you can start to set up a really good, forecasting and budgeting metrics here, and that's based on a good foundation.
And then, obviously, you know, what a lot of people come to platform like us for is, you know, that cost savings. So optimization recommendations, and I'll show you a little bit more around that within the platform as well as things of understanding, okay.
I don't wanna be just be, you know, proactive. I need to be reactive because these things are dynamically changing.
So then how does anomaly alerts work within the platform too? So I'll start to take you through that into the, as we go through the demo in itself. But for the moment, I'll hand back to, Nathan for the next few slides.
Nathan Stevens 17:10 - 18:26
Yeah. And just quickly thanks, Ravi.
So quickly, just to cover off, I always like to sort of finish this section with a case study. Since it's a really good one, it's in use data bricks, but from we're looking at data cloud as a whole here.
So there's a fantastic opportunity here to really get that assessment done, get that visibility into your data cloud environments, and actually go and take meaningful action on what is found out there. So the recommendations here, they're really driving that annual cost reduction.
So on the left here, 7. 5% reduction in ten days.
On the right, this is where we started to use and, you know, internally within Flexera. You know, we did this ourselves as well, so the proof is in the pudding here.
And also in ten days, $800,000 in savings across our annualized, you know, data procunist savings that were actually realized. You know, $68 a month is nothing to, sniff at.
So it's fantastic opportunity here to look at where this can be saved and then some real world examples. Alright.
So I'm gonna hand over to Ravi now. He's gonna jump in and give us a demo of the platform.
I'm just find a time for him to get ready and maybe click the button, and I'll hand over to Ravi, who's gonna take you through those key areas of the platform.
Ravi Pankhania 18:26 - 26:42
Thank you very much. Let me go ahead and share my screen.
Okay. So what you're seeing on the screen, right now is the, the Flexera one platform as it pertains to the data cloud optimization, aspect.
So I'm gonna really go through a couple of, things here. We're gonna look at visibility, which is really kind of the dashboarding capabilities.
We'll go into granular visibility, and then we'll finish off with optimization in itself. So the first thing that you're seeing on the screen here and bear in mind, this is my demo environment, so all these extra buttons you're seeing on the left hand side is just because of our demo environment.
I've got access to everything. But the first thing that we're showing here is the dashboards.
Now I wanted to start here at the FinOps, practitioner dashboard just to basically show, hey. What we're doing here is collaborating with multiple teams.
And the idea here is to look at the overall spend, within your different platforms. So, again, here, if we look on the right hand side here, I've grouped all the different cloud vendors.
And, of course, we've got Databricks as well as, Snowflake that's identified in this. So that's just the first step to kind of start to dig into making sure we've got all the visibility, at a high level.
If I go to my picker at the top left hand side here, now I can get a little bit more granular. We've got lots of different, dashboards.
I'm gonna go specifically to my snowflake analyzer in itself. Now this is gonna give me a little bit more information around the snowflake environment in itself, and so let me just walk you through that now.
So on the top hand side here, we've got snowflake spend by category. Again, this is the main fundamental aspect of this.
Where is my spend going? What is the main group we got my spend? And let me just see on a month to month basis. Right? You can filter these out as you see fit.
Again, I've only just done in the last couple of months, just part of my demo environment. But what we're doing here on the right hand side is we're making sure we're cherry picking the main spend, contributors within any given environment.
So that tends to be the highest spend, which is, compute. So compute warehouses, that's very, very common.
The next thing, which tends to be relatively smaller, is your storage costs. And we know why that's smaller because the pricing tends to be very much more, smaller compared to the compute costs.
Right? And then in here, the middle here is showing you the cloud services. Now this is just an understanding, you know, how much are you using all that compute, who's using it, and, you know, how much, spend is going on actually running and using those warehouses.
And, again, just keep conscious here. Take, a picture, sort of, the numbers that we're seeing here because, again, this is my demo environment. High level that is.
As we scroll down, then we start to see a little bit more granular detail. So we've got snowflake spend by specific service.
So I can start to come in here, start to manipulate this. Again, another, snowflake spend analysis.
And then as we start to come down here, what we're starting to see is a breakdown of the warehouses. Right? So we have a warehouse, different types of warehouses on my left hand side here, and, again, the corresponding, table to show you a little bit more granular view of that warehouse spend in itself as well.
We do that as well for warehouse type, so different types of sizes, and you can start to filter down on that. And, again, not forgetting the storage cost, as we have it here as well.
K? So this is just showing you a high level view of what is my Snowflake environment doing today, and make sure that I've got a little bit of a view of that. Right.
Now we've got that high level view, kinda sorted. Let's go a little bit more granular.
Okay? So now I'm saying, well, okay. I I understand what's happening in my environment, but there's some things that I wanna have a little bit more of a deep dive in and I wanna investigate.
So in this product here, we've got something called the tabular view, and this is a really great way to start to slice and dice up the data as you see fit. Right? And this is amazing.
What not just for the level of granularity, but the fact is that I can add multiple different dimensions, and dimensions are essentially different characteristics within the cloud platforms and itself. So that's kind of where we're able to kind of slice and dice up this data.
We're able to we're able to kind of come in here and kinda start to select these or unselect these and start to have this on a on a variable basis. Right? So I've selected snowflake for now.
I can then add in multiple additional dimensions. And one thing to note is we've added, additional, attributes that pertain specifically to Snowflake.
Right? So we've got cloud vendor account name, which is the actual account, in Snowflake, and then we can have the location as well and then those Snowflake services. And then as part of that, kind of this kind of goes into the cost allocation aspect of this.
You know, something you can do within the platform is say, okay. What cost center does it, does it, allocate to? Right? So that I can go ahead and say, right, go ahead and only view this specific cost center.
So as I'm starting to click around here, you can see the the table below me starting to kind of manipulate in real time. And this is just showing you essentially the data and the way that I've sliced it up.
I then get to then group it as well in multiple different ways. So here again, there's some same level of attributes that we have that we can slice and dice it up.
I can then group this by. Now this is fundamental.
Right? We see a lot of clients say, well, actually, I wanna group it by a specific app ID or specific project. However you want it grouped, that's exactly what we want you guys to have in that level of power as well.
So then I can come in. I can see on a month to month basis what those credits will see.
Okay? One thing to note on this is whenever I start to look at that, that table, I can also then start to have to view all those anomalies that pertain to that table as we go. So this is kind of in real time.
What the platform is doing is identifying all the different attributes that I've put into that table, and then it's gonna filter out, and it's gonna identify any anomalies that I see within the environment. Okay? This is part of a core feature within the product, something very cool.
Let's move on to optimization. Conscious of timing here.
So let's move on to optimization. So the first thing to note is our optimization page has everything.
Right? And that's the whole point of this. Everyone collaborates.
Everyone has an understanding of what the full potential of savings is. But at the bottom right here, I can see my snowflake, optimization.
So let's go into that. So as I click into usage reduction savings, I can then have so I'm gonna delete that for now because I wanna show you the full view.
First off, you're gonna see all the optimizations as we see here. And then if I want to group by policy set, and I say, hey.
Let's have a look at my Snowflake, recommendations. This is what we're seeing here.
So just to quickly take you through this, we have Snowflake rightsizing warehouse. So the recommendation on the top side here is saying downsize warehouse from extra large to large.
It shows you, metrics of, you know, when it was detected, what the potential savings are. If I go to my detail side, this will then give you an idea of, okay, what was it based on, the look back period, you know, what are the different attributes that we're looking at, and, essentially, give me a little bit more understanding of why you've done this as a recommendation.
So here we can see, compute utilization. And then we also look at the trends of how well it's being used.
Right? If it's on an upward trend, then we're not gonna show that as a rightsizing recommendation. If it's on a downward trend, then we will do.
We also have dimensions that are associated to this, and I'm specifically talking about tag dimensions. So anything, you know, that you when you're doing your cost allocation, you can start to view that in the optimization page as well.
And then the second one is, auto suspend. Right? So understanding, you know, reducing that runtime from, in this scenario, nine hundred seconds out to sixty seconds, These things do accumulate, and they can accumulate and kind of push the bill up.
And so we're making those recommendations. Again, the same scenario here, you're gonna see those details as well as the additional, tags associated to that so you can start to make those actions, accordingly.
Okay. So I'm gonna that's the end of this demo.
I'm gonna go ahead and hand back to, Nathan for the last part of.
Nathan Stevens 26:42 - 27:15
the session. Awesome.
Thanks very much, Ravi. And, so thank you to everybody that's joined us today.
I'm just gonna summarize a couple of the questions. So feel free to please reach out to us both as well if you wanna engage and talk more about this topic.
I'm gonna summarize some of the questions that we've got through. So first one.
So, Ravi, maybe for you. So if you walk into an organization tomorrow that had never actively optimized Snowflake, what are the first three things if you look at to find savings?
Ravi Pankhania 27:15 - 28:25
It's kind of what I was mentioning before. The first thing is if you wanna look at savings, you need to know who's doing those savings.
Right? You wanna understand if there's any sudden consumption increases, of where those workloads are. So the first thing I would say is visibility on that.
Right? So you wanna have a view of, okay, where's the lowest hanging fruit and then go after that. So that's the first thing.
Second thing is you need to understand, well, who is doing this. Right? What's the ownership around this? Who's the workload owner? Because there is a conversation to be had with the engineering team.
You don't just wanna go away and optimize things, by yourself. You wanna have an understanding of, is there a reason why this cost has gone up and it increased? And if so, you need to have some additional context to that.
So that cost allocation and ownership is very much key. And then the last part is understanding, okay.
Let's go in. Let's have a look at those idle, the idle time.
Let's have a look at where we can do some, rightsizing metrics. But, essentially, I would do it in that order, understand where your low hanging fruit is in terms of visibility, whose ownership of that or who's actually looking after that, have that conversation, and then do kind of the rightsizing optimization as a day two.
Nathan Stevens 28:25 - 28:48
practice. Awesome.
Good one. So, Nava, just once again, a few questions about where does, like, Snowflake sit within organizations? So what does good Snowflake FinOps actually look like? Who should own it? You know, is it the FinOps team, data engineering, individual workflow owners? What does good look like?
Ravi Pankhania 28:48 - 30:03
Yeah. That's a great question.
And you know what? I think it's a combination of all three just to answer that straight up. And we've recently started to see Snowflake really lean into the FinOps Foundation.
Right? So if they have actually understood that actually, you know, within the industry, FinOps is one of the major things that we need to have a good Snowflake environment, to make sure that we are, you know, very much more valuable, to the business. And so it's a huge collaboration between the data platform teams, engineering teams, as well as the FinOps teams.
And like I mentioned before, the priorities are different, and they should be different because their respective fields are different, and the level of intelligence and information that you gather is very different. And so not one person or one team is gonna cover all those bases.
So it is about making sure, you know, you have different functions involved because they all have their individual responsibilities. And when you have that, then you're able to go across the whole landscape and make sure you're covered in that scenario.
So it's you know, we're not just talking about cost reduction exercise. That's not what FinOps is, and we're not just doing it in isolation.
It's about a a good framework to make sure everyone's accountable, make sure it's we're doing best for the organization in that sense.
Nathan Stevens 30:03 - 31:26
Yeah. Exactly.
And I think you look if you look at the FinOps practitioner being the governance layer working with those teams to get the best outcomes, that's that role of that FinOps practitioner within that organization as well. So, look, at the top of the time for today, I think, we'll try to answer some of the questions.
A couple quick ones, capabilities available now, so please reach out to your, you know, the account managers, your CSMs, the people that you work with directly at Flexera. Feel free to reach out to Ravi and I.
We can help connect with the right people internally. Sometimes it could be ourselves.
And also as well, there's a lot more coming in this space, a lot more recommendations planned as we start to work with customers throughout the next, you know, year or so, looking at expanding what we can do in this space as well. So, I think we've answered a whole bunch of questions that have come through.
We've grouped the market into some of the larger topics here. Once again, Ravi, thank you very much for joining us today, giving your insights and intelligence around this topic.
Thank you everyone for joining us today. Please feel free to reach out and engage, connect with us.
I'm more than happy to drive into these topics more. And for those watching here, hope you've enjoyed.
Please look at the events coming up. Registration will come out soon for the next ones, and give us some feedback about what you'd like to see next.
So thank you very much, and have a good day.
Let’s get started
Our team is standing by to discuss your requirements and deliver a demo of our industry-leading platform.