
Webinar
FinOps metrics that matter: How to measure success without drowning in data
Related Solutions
Overview
Most FinOps teams have access to more data than ever, but that does not always translate into better decisions or clearer proof of success. With hundreds of metrics available across cloud, SaaS and tooling, teams often struggle to separate what is interesting from what actually matters.
In this 30-minute on-demand webinar, Flexera experts, Nathan Stevens and Nathan Green explore how to define, measure and communicate FinOps success using the right metrics at the right time – helping teams move beyond dashboards to outcomes that demonstrate real business value.
You will learn how to focus measurement across cost optimization, accountability, efficiency and maturity; avoid metric overload; and turn FinOps data into insights that finance, IT and business leaders can understand and act on.
This session is ideal for FinOps practitioners, cloud cost managers, IT and platform operations leaders, finance and technology stakeholders, and ITAM or SAM professionals extending into FinOps.
Key takeaways
- More metrics do not create better FinOps outcomes. Successful teams focus on the measures that reflect progress, behavior change and business value – not every available dashboard view.
- The right metrics change as FinOps maturity evolves. Early-stage teams need clarity and accountability; more mature programs should align measurement to outcomes, efficiency and sustained value.
- Metric overload weakens decision-making. When everything is measured, nothing stands out. Teams need to deprioritize vanity metrics and focus on the signals that guide action.
- Stakeholders need value narratives, not just data. FinOps teams must translate cloud and SaaS data into insights that resonate with finance, IT and business leaders.
- Flexera helps teams stay focused on outcomes. Flexera’s FinOps-certified platform and value-led frameworks help simplify measurement, maintain focus and sustain success over time.
Speakers

Nathan Stevens
Senior Director, Solutions Engineering (APAC)
Flexera

Nathan Green
Solutions Engineer
Flexera
From FinOps metrics to business outcomes
Why more metrics do not equal better FinOps
FinOps teams can easily over-measure, creating metric overload and misaligned KPIs. The webinar explains how to avoid common pitfalls and focus on the measures that support better decisions.
Outcome: Teams simplify measurement and prioritize metrics that drive clarity, accountability and business value.
Which FinOps metrics actually matter
The session explores the measures that best reflect progress across cost optimization, accountability, efficiency and maturity – and which metrics can safely be deprioritized.
Outcome: Teams can separate useful signals from noise and focus on metrics that show meaningful progress.
How measurement evolves across maturity stages
FinOps measurement should evolve as a program matures. The webinar explains how to align metrics to business outcomes rather than tooling outputs.
Outcome: Metrics become relevant to the organization's maturity and strategic objectives.
How to turn metrics into outcomes leadership understands
The session shows practical ways to translate FinOps data into value-based narratives that resonate with finance, IT and business leaders.
Outcome: FinOps teams communicate impact in terms stakeholders can understand and act on.
How Flexera helps teams focus on outcomes
Flexera’s FinOps-certified platform and value-led frameworks help teams simplify measurement, maintain focus and sustain success over time.
Outcome: Teams can move beyond dashboard volume to repeatable, outcome-led FinOps measurement.
Strengthening FinOps impact with proof and alignment
- FinOps teams have access to more data than ever, but more data does not automatically create better decisions or clearer proof of success.
- The webinar focuses on using the right metrics at the right time to help teams demonstratereal business value.
- The agenda covers metric overload, measures that reflect progress, FinOps maturity stages, leadership-ready value narratives and Flexera’s outcome-led approach.
Frequently asked questions
FinOps metrics that matter are the measures that help teams demonstrate progress, accountability, efficiency, maturity and business value – rather than tracking every available data point.
FinOps teams often have access to hundreds of metrics across cloud, SaaS and tooling. Without clear priorities, teams can measure too much and lose sight of the insights that support better decisions.
As FinOps maturity grows, metrics should move from basic visibility and accountability towards outcome-led measures that connect cloud and SaaS optimization to business priorities.
FinOps teams should translate data into value-based narratives that show business outcomes such as cost optimization, efficiency, accountability and improved decision-making.
Flexera helps teams simplify measurement and maintain focus through a FinOps-certified platform and value-led frameworks designed to support outcome-based FinOps success.
Transcript
Nathan Stevens 00:35 - 00:39
Yes. Right.
Thank you everyone for joining us today.
Nathan Stevens 00:39 - 00:40
We'll just.
Nathan Stevens 00:40 - 06:08
allow about twenty or thirty seconds for everyone to jump into the session, get familiar with Goldcast, get themselves comfortable for the next thirty minutes as we're gonna take you through FinOps metrics that matter. So I can set already see a few people starting to join us, here, so it's good that everyone's got the link and can get in.
Alright. So with that, once again, thanks everybody that's joined us today from wherever you are around the world.
I'm Nathan Stevens. I look after the solution engineering team here in APAC, and today I'm joined by Nathan Green.
So it's the Nathan show today, and he's one of our senior solution architects and, you know, specializes in the field of space. So today, we're gonna focus in about the metrics that matter.
So wading through the noise that you get with, you know, all of the data that we collect today, all the different dashboards and data points and, you know, source systems and everything and what narrowed it down to what really matters when trying to devise your FinOps program. When we start to look back as well, for those that have joined us maybe for the first time, we're running this as a series.
This is the twelfth in the series. So there's a fantastic set of topics and guest speakers that we've had over the last now year or so, across a number of these, different capabilities and outcomes that we're looking to drive with the technology.
So we'll post the link to, these in the chat. So if you have to click through those and actually go through and watch those on demand, they're fantastic content to catch up on.
And if there's particular interest in any of those, you're more than welcome to reach out to us directly as well. Alright.
So, just to recap, today, you know, today, July 16, we're going to focus on FinOps, metrics that matter, take you through some of the success stories, look at the FinOps Foundation as well. They do some really fantastic work in this space.
Next month, we're gonna probably touch on the hottest topics, in the industry right now, the economics of tokenomics. So if I'm taking that up, prompt, pay, and repeat, and start to explore what are the cost drivers and market trends around, tokenomics and where that's headed as well with Flexera.
Finally, in September this year, we're gonna deep dive into our Snowflake, in that data cloud space offering, really look at how costs can spiral out of control, with Snowflake, understand the cost drivers behind those, and take a really deep dive into what does that look like within the Flexera One platform. So three fantastic topics to cover and more to come for the rest of the year.
Alright. So just to start with, we just wanna really position this in terms of, you know, where the market's heading and especially over the last three years is we start to see, obviously, those that's trend of cost surging and increasing year over year.
We can see this in the market, especially around the fin ops, which has that 47% increase. SaaS is 51%, but also as well AI spend.
Now this is a stat from last year around 644,000,000,000. We're now in the trillion expected to grow in the next few years.
So this is the area of focus. This is the area of biggest, cost explosion, for lack of a better term there.
We're really at the tipping point now where something needs to be done before these get out of control. So today, we're really gonna focus in on a few key areas of the platform.
Now typically, we might have one of these highlighted, but within the Flexera one platform as a whole here, we're really gonna focus on the three on the right hand side and touch on elements of those with different KPIs and different metrics. So this is part of our FinOps offering, and there's a lot more, than what you'll see today in there.
But this is just glimpse of really about the metrics and driving those business outcomes with the data that we're collecting. Alright.
So to use an analogy to start with, I think when you start to look at every organization that's out there, When you first go in, you know, get your development team, your cloud engineers, they always want the latest and greatest, you know, the fastest car, the Formula one car on the right hand side. Now that's not always required to just get the job done.
So when we start to look at measuring things that are relevant and important to driving the outcome here, you know, do we really need to look at the Ferrari, which the cost per widget within your organization is hundreds of thousands of dollars, or could we just deal with simple Toyota? You know, it gets the job done. It's right on the money.
The guardrails are just in place to ensure that we're spending what we need to get that business outcome. And we can reduce that per widget cost significantly down, you know, to just the Toyota, which is good enough to get from the a to b to drive the business.
So that's the analogy we, you know, always like to use is not always go for the Ferrari, go for the thing that's white size to actually get the outcome that you're looking for. So I really wanna start today.
Nathan now is really gonna take us through what that problem was about why we're in the position today. So over to you, Nathan.
Nathan Green 06:08 - 07:05
Yeah. No.
Thanks, Nathan. And I love the Toyota analogy.
Sometimes that that's good enough. But you're totally right in what you're saying in terms of, previously, customers would have had management of on premise hardware and software, and that's really all they had to worry about.
With this explosion of AI, with data ops, with Kubernetes cost cloud, it's becoming a complete explosion. So many data points, thousands and thousands of data points, which means certain teams are looking at certain datasets.
But for the overall business outcome, they're maybe losing that context. So having these data points often doesn't bring confidence.
It brings confusion. And I think you'll probably talk on the next few slides just to really around narrowing down and focusing on those exact data points, Nathan.
Nathan Stevens 07:05 - 07:46
Yeah. Exactly.
So I think, you know, to your point there, it's you know, all of this noise, thousands of data points is really what's relevant through for your business. So the aim here is we need to cut through the noise and really measure what matters.
And I I love this, imagery here because it shows, you know, out of all the data points, all the numbers, is there three things that really matter in your business to measure? What are the three things that are relevant that drive the outcomes for you? So let's start initially, let's start, Nathan, take a look back at, you know, the measurement trap. Why this fails to start with?
Nathan Green 07:46 - 14:45
Yeah. Exactly.
So many customers that I work with often fall into the, I suppose, the four common traps. They're measuring absolutely everything.
They just have too much data, too much, historic data of from different disparate sources. They lose, again, the meaning of that data.
What are they trying to achieve? What is the business outcome that they're trying to achieve? Often, teams, they're tracking activity as opposed to understanding what is the business KPI? How does this relate to profit margins, how does this reduce waste, how does this actually help the business in terms of cloud cost. Obviously, with FinOps and the FinOps community, it's really about being that central team.
So there's different personas within the business. We want to ensure that those teams have the same KPIs and same metrics.
And then previous to the slide that I just shown, you have all of these disparate reporting tools. They're all segmented.
They all have a different view of the landscape. But, really, are they influencing the business, or are they just data points? Are they informing users, but not actually transforming the business? And on the right hand side, you'll see what businesses often do well, what often they struggle with.
So they can get the telemetry, they can get the metadata, they can have a view of the metrics and the KPIs, but translating that into insights, into decisions, and into business outcomes, essentially, is really where some businesses that we work with often struggle. And I really love this quote at the bottom.
It says, FinOps isn't about more data. It's about the right focus to drive that business outcome.
And, again, it's not only from a technology perspective, but also teams. So bringing the community, bringing all of those different teams together to achieve that business outcome.
How is the data that you're representing today influencing that business outcome, influencing that decision? I think if you look at the next slide, you'll see where we've used some of the analogies that the FinOps, foundation are known for. So the crawl, walk, run methodology.
And, again, this is a simplified view just to give the people on the call some understanding. Everything derives from visibility.
You can't track what you can't see is often what we said to customers. So having that visibility into your cloud spend, into who's owning what, so the allocation of what spend, having that tracked or tagged, so ensuring that the teams that are managing that cloud cost have a tagging procedure or policy in place to achieve that outcome.
And, really, as they start to mature and evolve, they move into the walk phase. So now that you have visibility at the foundation there, we can start to look at rightsizing, reducing waste.
Do you have unused snapshots in the business? Do you, have you negotiated on using reservations? Do you have a forecast and budgeting policy and process in place? And once you've achieved, I suppose, the foundations in the crawl and walk, everyone aspires to get to their own stage. So from a unit economics perspective, do you know what the value of that service or that application or that business unit even is to, the overall business? So ensuring that you have a, for example, a cost per customer, that you're achieving those business KPIs, and you'll hear a lot today about outcomes.
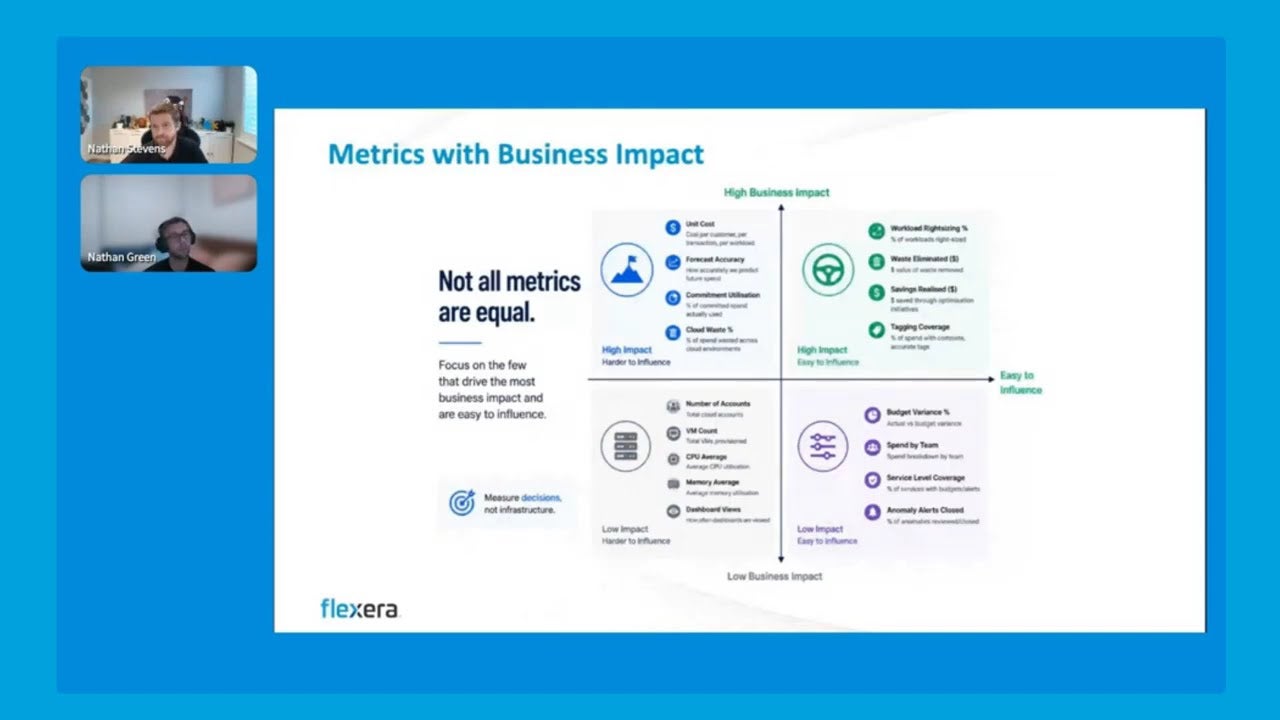
We wanna ensure that customers are focused on the overall business outcome, not just having disparate data sources that really bring more noise on clarity, uncertainty to the business as well. And I think if you look on the next slide, you'll see a very similar fees, but really how we can have high business impact and easily influence the business.
So on the top right, if we focus there as our as opposed quick wins, you can see things like workload rightsizing, eliminating waste, realizing savings, and having that tagging coverage. Again, the barrier to entry within the business is very low, very easy to influence, but has a huge impact on tracking those costs, on teams understanding those costs.
And, again, bringing it back to the KPIs, meeting those objectives and meeting those KPIs, things that a lot of teams may spend a lot of time on. Again, building dashboards on understanding or without understanding really what the outcome is to build that dashboard.
Why are you building a dashboard? Why are we reporting that? So you can see on the left hand side, CPU average, VM count, number of accounts. What does that actually mean? You know, what does that mean to the business? And I think if you achieve the top right hand side, so you've been able to achieve right sizing, you've been able to eliminate some waste, you've been able to realize savings, that gives you, I suppose I suppose it gives the business confidence on the harder to influence and high impact activities.
So now that you've done that, you can start to talk to teams about cloud waste percentages. Are they utilizing commitments? Do they have forecasted accuracy? So, again, building those blocks slowly with teams, taking small chunks and small steps has a huge business impact.
And you'll see here it says not all metrics are equal, and that's very true. Different businesses have different requirements and different, I suppose, KPIs and initiatives.
So we need to cater for that. So where some of the high impact and easy to influence, that will have a huge impact on, various businesses as well.
I think if we look at the next point again, FinOps Foundation has done an amazing job on the content that they provide to teams. So right through to listing all the KPIs, and you'll see some examples here.
So time to achieve business value, we've talked a lot about that already. Percentage variance on budgeted versus forecasted.
Do you have forecast accuracy? Do so does your budget actually project what your spend is? And, again, you can see your percentage variance across forecasted cloud spend as well. And I suppose on the nice triangle here, it's never this, I suppose easy in terms of once you have these building blocks, you have a business outcome.
But this is a good visualization on, I suppose, the steps for success, visibility, efficiency, understand your unit economic, and achieve the overall business outcome.
Nathan Stevens 14:45 - 15:45
Yep. Exactly.
And I think it goes back into what you were saying earlier as well about the crawl, walk, and run. It's not just, you know, tomorrow you're gonna hit your unit economics and, you know, start measuring those business outcomes immediately and then delay that foundation first, get visibility, get the allocation out there, then start working with the KPIs and driving this operational efficiency.
So I think this is a good representation about where to start. And then in each business as well, each of these layers are gonna have a different timeline.
Might be a day, it might be a week, it could be months, and just to get things right. But I think in the pursuit of perfection here, sometimes don't get caught in, you know, trying to be perfect in at that bottom layer because there's always gonna be some data point that's missing, you know, whether it's an isolated cloud instance or some new thing that's come to market yesterday.
So the raw data is never going to be perfect, but drive meaningful outcomes with the data that you have.
Nathan Green 15:45 - 15:47
Exactly.
Nathan Stevens 15:47 - 18:29
Alright. Obviously, as well, we wanted to quickly touch on I know next month we're gonna dive into this a lot more, but it's so relevant still in the FinOps space at the moment.
So, you know, we can't have a webinar today without mentioning, AI and its impact in, the FinOps space. So that is a very good slide.
Actually, I I repurposed this. I think it's from FinOpsX, actually.
A fantastic sort of imagery here in terms of, you know, what we see in FinOps and, you know, see we see in the finance space in particular is typically just that the tools and the headcount and the projects that are going on. So what we need to ensure, though, is when we're really looking at that total cost of ownership is everything else that may have a variance or an impact or, something that can drastically change sort of the forecast that you have around AI spend.
So whether that's, know, the model retraining or, you know, the GPU reservations, you know, everyone's, you know, putting that demand and increasing cost in this space, you know, and what are the other tooling and, that's being used. The cost per tokens are so variable these days with the different models, cost per token rate.
So all of these factors are significantly influencing what the what the paid ops practitioners are doing, in this space, and it's hard to get away from that as well. So I think really when we start to look at metrics around this is, you know, start thinking about and looking at metrics like the AI cost per prompt and, you know, cost per feature.
You know, what is the, you know, carbon efficiency of, you know, this AI service versus a different AI service? Because we wanna also, you know, have that impact on, you know, the water usage, electricity, and carbon, waste as well. So there's different metrics we can help drive how efficient AI has been using relating that back to, business outcome in the service again.
But I do think when we look at this particular case study, fantastic case study on the FinOps Foundation, it's a good public reference around the impact of unit economics here. So when we start to look at this particular company, they had what is the cost per thousand streaming hours as their North Star.
And now this is what's critical then to them as a business. So how can they, over time, using the FinOps practices, reduce that down so that the cost for those thousand streams is, you know, lesser than it was today?
Nathan Stevens 18:29 - 18:29
And.
Nathan Stevens 18:29 - 20:14
what they managed to do through looking at the cost per compute and cost per gigabyte and eventually got that down to a negative 28% reduction in cost overall year. So, this is a fantastic example once again of measuring unit economics, making it relevant for the business here.
So whether they, you know, save on, you know, add additional margin to those thousand streaming hours or whether they actually have that room to innovate now, they can reinvest back into the business. And through the process of bringing everyone on board on the journey of FinOps, you know, they also managed to have an impact on, the engineers.
So getting Slack notifications, pushing out details into, you know, different natural language querying, into the different platforms to actually understand that, you know, the decisions that the engineers are making have a significant cost impact. It's not just a I wanna go through this model because it's the Ferrari of, like, that particular compute, in Azure.
And it was the largest database with the biggest IOPS, available. It's about well, once again, is the Toyota good enough for the workflow that we're running to reduce, you know, to have a non buffering streaming service as is the case with this business.
So what we'll do now is, I'm gonna jump in. Nathan's actually gonna show us, a few of those examples within the Flexera One platform and what you can actually do, within the system as well to demonstrate some of those metrics actually matter.
So, Nathan, over to you.
Nathan Green 20:14 - 26:29
Awesome. Oh, thanks for that, Nathan.
A great use case in, you know, how customers can achieve those outcomes and how they can track those metrics. On the screen, you can see a persona based dashboard.
So it's an executive summary. And if we think back to that visibility layer where I first talked about, visibility and allocation, here you can see a breakdown of the total cloud spend across applications.
So here you can see the different applications within this business. So they've allocated these applications.
They're able to see month on month what the spend is per grouping of that application. In a similar way, you may want to track the trend.
So how are you trending month on month? Are you having increased cost? Are you reducing the cost? Are the initiatives and the KPIs that you tracked last month actually being followed through by the team? So Nathan raised a great point around engineers. So engineers are very focused on having the latest and greatest.
But as their thinking shifts left, that can reduce cost significantly. So shifting left with some of those KPIs, understanding that that comes from the architecture and the review and design right through to BAU and the day to day.
So, again, having that visibility, tracking across spend, and maybe even tracking daily charts to understand what services, what categories you're actually reducing on. So taking the database example that Nathan tracked, you can see significant cost reduction month on month.
So 6,000,000 down to almost 2 and a half, 3,000,000. Again, not a small feat.
You know, this is a lot of, money that can be reinvested into the business. We're going to move on and start talking about AI in a second, but those initiatives can then be funded from the cost reduction of the business through, again, small changes, incremental changes by teams, different thinking around how teams are deploying, how they're managing, and how they're being more cost effective with cloud spend.
And, again, you can track not only the cost but the saving per month. So here you can see the list price, what the actual cost is that has been negotiated, and then importantly, the saving.
So here's, savings of potentially 22%. So, again, massive visibility into understanding how these categories can be reduced year on year, month on month.
And, again, that's the first layer. That's the visibility layer.
If we move now into looking at an initiative, so we're gonna take AI because it's the flavor of the month, the flavor of the 2026. And here you can start to track certain, services that are utilizing, AI.
So you can see the top 10 services per cost. These will be very familiar for some people.
So you have Claude, obviously, Kendra, you have Cortex. Really useful for understanding are the company's initiatives that were funded using AI, are they actually profitable? Are they on budget? Do we need to reduce that spend? So here you can see in this instance, it's very heavily focused on AWS.
So, again, a lot of the AI and ML service is being used on AWS, and there may be an initiative to move some of that into GCP. So, again, tracking that, understanding can you, reduce that cost, understanding the certain metrics.
So Nathan mentioned about usage. So we have tokens.
We have ours. We have API calls.
The various metrics that can be used to understand the core value, the core business unit economic for certain teams. And, again, we can look at this in a more granular view for people that like to get into the the detail around usage amount, usage unit, the cost for that unit, usage type, workloads and so on.
Again, this is all visible within the platform. And here you can see really nice is the billing center mapping.
So billing centers in the Flexera terms are sent essentially the cost allocated group. So this might be an application.
It might be a BU. It might be a team or a department.
Here, we can track the AI, spend essentially per billing center. So here, you can see generative AI.
You can see here the various kinds for Vertex. And then here you can see the most expensive regions.
Again, we're starting to move from that first visibility to move into a walks phase where you're looking at the actual initiative. But what does this mean in terms of the overall KPI? So how can this be tracked? How can this be managed? And, again, within Flexera, we can show the saving percentage over time.
So if it's workload optimization, if it's commitments and with, negotiations there, if it's actually understanding initiatives are costing too much based on the budget spend, I'm pulling that away and reassigning that to a a different initiative. So here you can see cost month on month.
You can see the realized saving. Again, a great realized saving over twelve months.
Here you can see the total percentage. So, again, if this is a metric, initially, was this funded from the business that you needed to reduce your saving percentage by 15 or 18%? We can track that within the platform.
I touched on commitments. Again, we can show you on demand, reserved saving plans, and spot instances where you're covered, your coverage percentage across that.
And then as Nathan mentioned in the use case, looking at the cost per x, so the cost per compute, the cost per database, and how that's trending over time. So here you can see again from January right through to July, there's been a reduction this month in cost.
Mhmm.
Nathan Green 26:29 - 26:29
On.
Nathan Green 26:29 - 27:10
month to month, there's obviously an initiative to understand the compute cost, per unit over time. And, again, this can only this can be various services.
So the example here is compute. It could be storage.
It could be cost per gigabit stored. It could be database as we've seen above.
It really depends on the business outcome and tracking that unit cost against that outcome. Yeah.
I think that's all I wanted to share in terms of the dashboarding, Nathan. I know I can see a few questions coming into the chat just now.
Do we wanna refilter those?
Nathan Stevens 27:10 - 28:20
Yeah. Exactly.
So maybe, just if you stop sharing there for a second, Nathan, perfect. So probably one of the, you know, a bit of chatter around in the AI capability that you just saw on the screen that I'll, I'll take, as well.
But I think, obviously, as well, there's a lot of interest in AI spend at the moment. The one that you see on the screen that Nathan was showing is available within the cloud cost optimization part of the platform.
So if you do wanna know more about that, please do reach out to whether it's myself or Nathan. You know, you've got your account reps and the solution engineers globally that are more than happy to talk through what we can do in that space because, obviously, as well, that's the biggest area of, growth in spend that we wanna address.
Nathan, another question that's, come through is, you know, Nathan, in our experience and I and Nathan, in in your experience, I feel like I'm talking to myself half the time, working with customers, what has been some of the metrics that have been implemented and successful? Not just the marketing where brochure where, but real world examples.
Nathan Green 28:20 - 30:24
Yeah. Good questions.
I think one I suppose one of the easiest things is obviously reduced cost, And in that, the metric is reduced waste. So we've had a lot of customers that utilize our automation policy to understand where unused services are.
So an example with the customer where they had a target of 15% of their top 15 business units needed to reduce their spend. Deploying the, rightsizing recommendation on, unused policies, we were able to, get a metric of 18% of that spend per BU.
So of the top 10 BU spend, we were able to see them 18% of their cloud spend within that just by understanding the wastage. Suppose from a practice perspective, a big one that we see is tag coverage.
So a lot of customers start their pin ops journey. They have a very low percentage of tag coverage.
So working with customers, it could be 50% of resources are tagged. They go through a process of tagging every, every service within the cloud.
What the net benefit of that is is they're able to then successfully allocate that cost. And it's not only VMs that they're tagging, it's actually shared services as well.
So we do have that capability where we can distribute that shared service cost, to help understand the total cost of ownership per team, per application, per initiative. So that again, hopefully, that's answering the question.
But that's where I've really seen success is rightsizing, workload optimization, and then teams getting that visibility and being able to allocate that cost so that a team can actually understand this is what our spend is per month, per day to the business. Awesome.
Nathan Stevens 30:24 - 32:12
Now I appreciate that from the real world experience there, Nathan, not just, what people are listening to me half the time. So, one final question to wrap this up today as well.
So I think I might take this one, about how do we get there to the outcomes, who can help define the metrics, and what we're seeing today. So I think it's very important that we, you know, collaborate in this space, in this ecosystem.
Obviously, there's some fantastic partners out there that, our customers can work with who are pin up specialists in this space that can help leverage a Flexera platform to drive these outcomes. We also have a a great set of, solution architects and advisers across the business that can help collaborate, you know, with those partners, with our customers as well to try some guiding or guidance around the spec best practices, but also as well as we saw in one of the previous slides there.
The founders foundation is a fantastic place to go to start mapping out that journey. You crawl, walk, and run and map your KPIs back to that as well.
It's not an overnight thing. This takes work.
The case study we showed before was a twelve month journey to get to that 28% saving across the streaming hours. So, put it in place and get that program in place and then leverage the ability to your partners, you know, Flexera, and the foundation there to get to that outcome.
So believe we're at time today. Nathan, thank you very much for joining us, and presenting on this place.
I know you're super passionate about the funeral space. If anyone wants to reach out to us, please do so.
Look us up on LinkedIn. Drop us a note.
As always, more than happy to chat through, the topics that we've been speaking about. So once again, thank you very much, and reach out to you soon.
Thank you.
Nathan Green 32:12 - 32:13
Thanks, everyone.
Let’s get started
Our team is standing by to discuss your requirements and deliver a demo of our industry-leading platform.